

Answered step by step
Verified Expert Solution
Question
1 Approved Answer
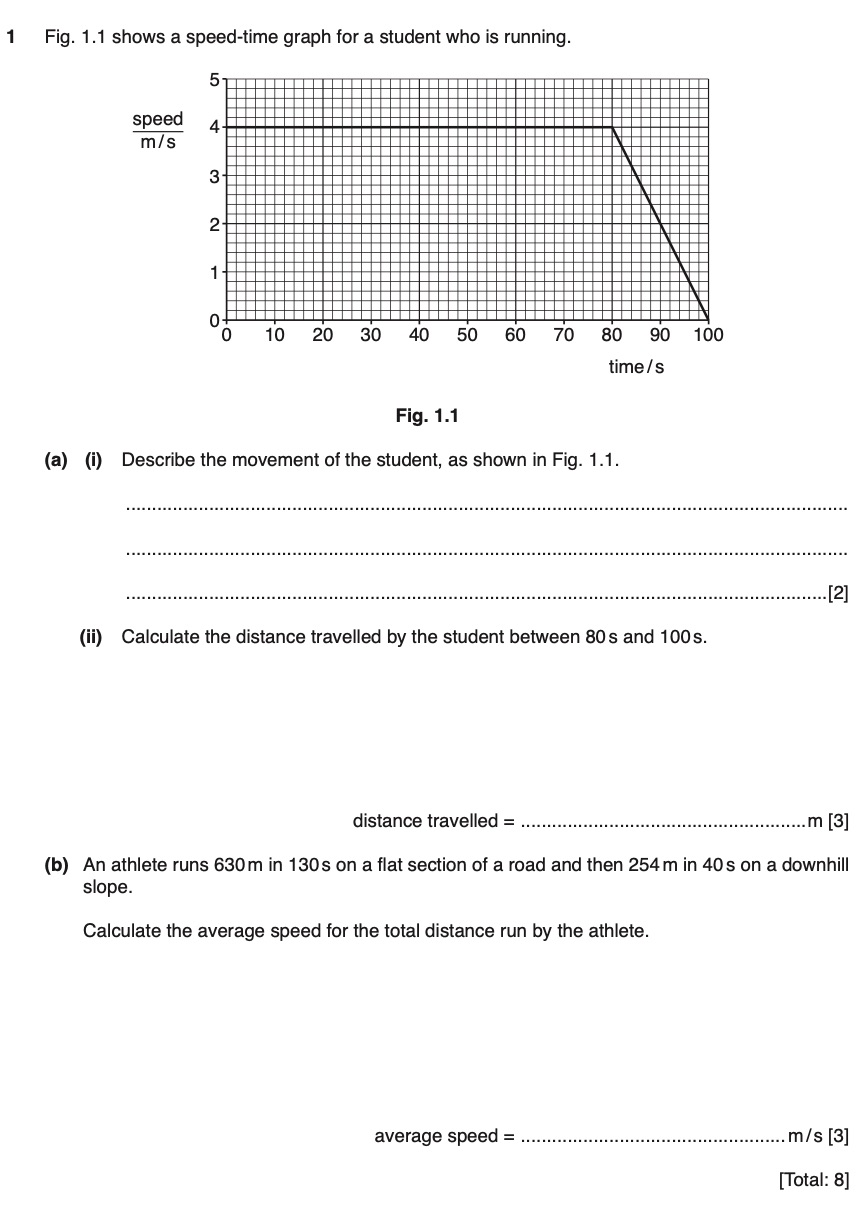
1 Fig. 1.1 shows a speed-time graph for a student who is running. 5 speed 4 m/s 3 2 1 0+ 0 10 20 30
Step by Step Solution
There are 3 Steps involved in it
Step: 1

Get Instant Access to Expert-Tailored Solutions
See step-by-step solutions with expert insights and AI powered tools for academic success
Step: 2

Step: 3
Ace Your Homework with AI
Get the answers you need in no time with our AI-driven, step-by-step assistance
Get Started
Lectures On Quantum Mechanics
Authors: Steven Weinberg
2nd Edition
9781107111660