Answered step by step
Verified Expert Solution
Question
1 Approved Answer
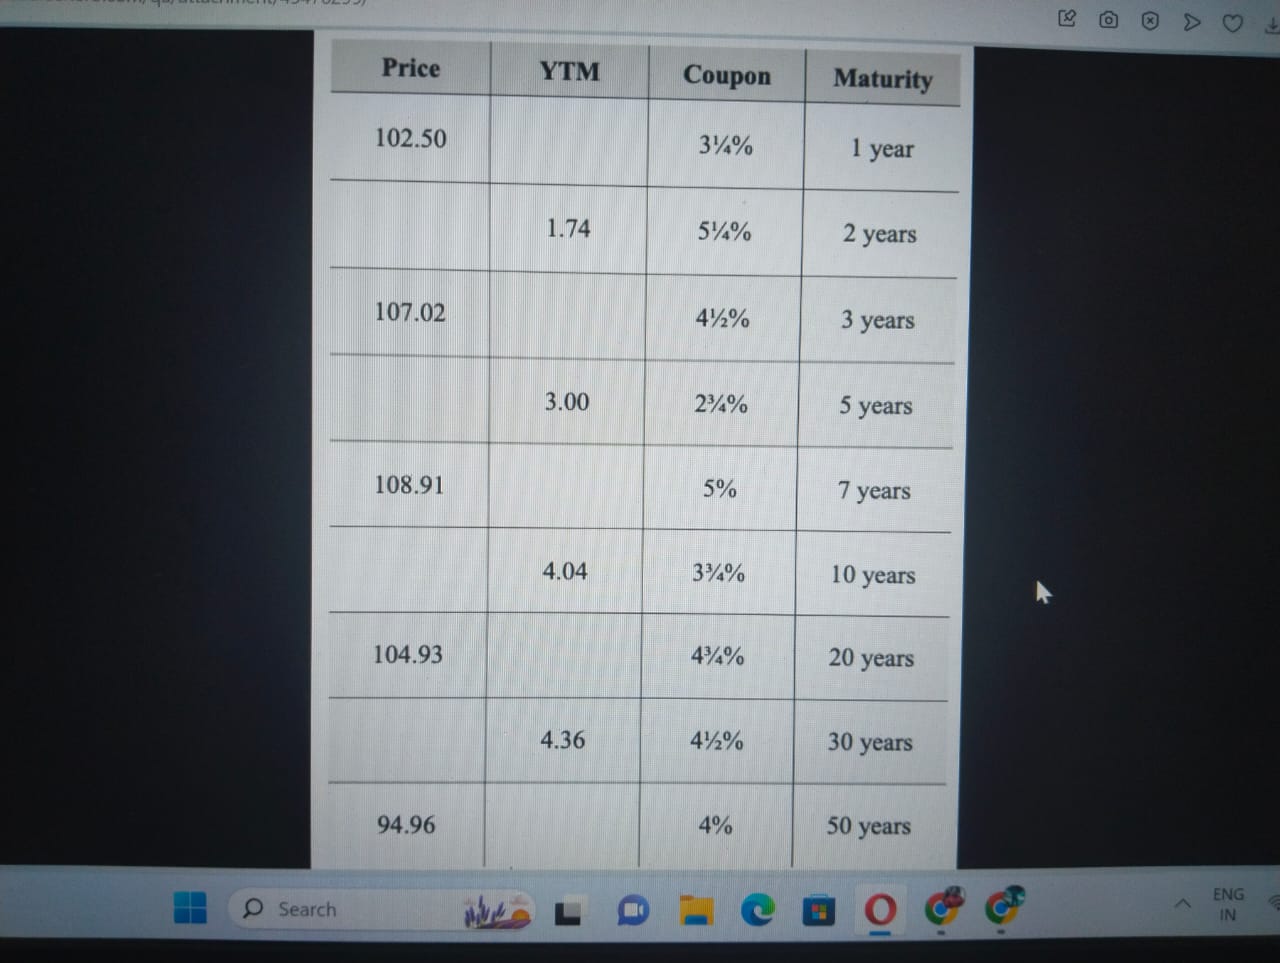
1. Fill in the missing values 2. Plot the yield curve that results from the given bonds. 3. What happens to the bond prices if
 1. Fill in the missing values
2. Plot the yield curve that results from the given bonds.
3. What happens to the bond prices if all the yields move up by 1%?
\begin{tabular}{c|c|c|c} \hline Price & YTM & Coupon & Maturity \\ \hline 102.50 & & 341% & 1 year \\ \hline & 1.74 & 541% & 2 years \\ \hline 107.02 & & 421% & 3 years \\ \hline & 3.00 & 243% & 5 years \\ \hline 108.91 & & 5% & 7 years \\ \hline 104.93 & 4.04 & 3343% & 10 years \\ \hline 94.96 & 4.36 & 421% & 30 years \\ \hline & & 4%% & 50 years \\ \hline \end{tabular}Step by Step Solution
There are 3 Steps involved in it
Step: 1

Get Instant Access to Expert-Tailored Solutions
See step-by-step solutions with expert insights and AI powered tools for academic success
Step: 2

Step: 3

Ace Your Homework with AI
Get the answers you need in no time with our AI-driven, step-by-step assistance
Get Started


