Question
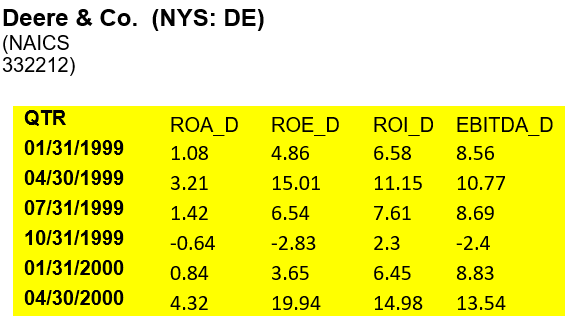
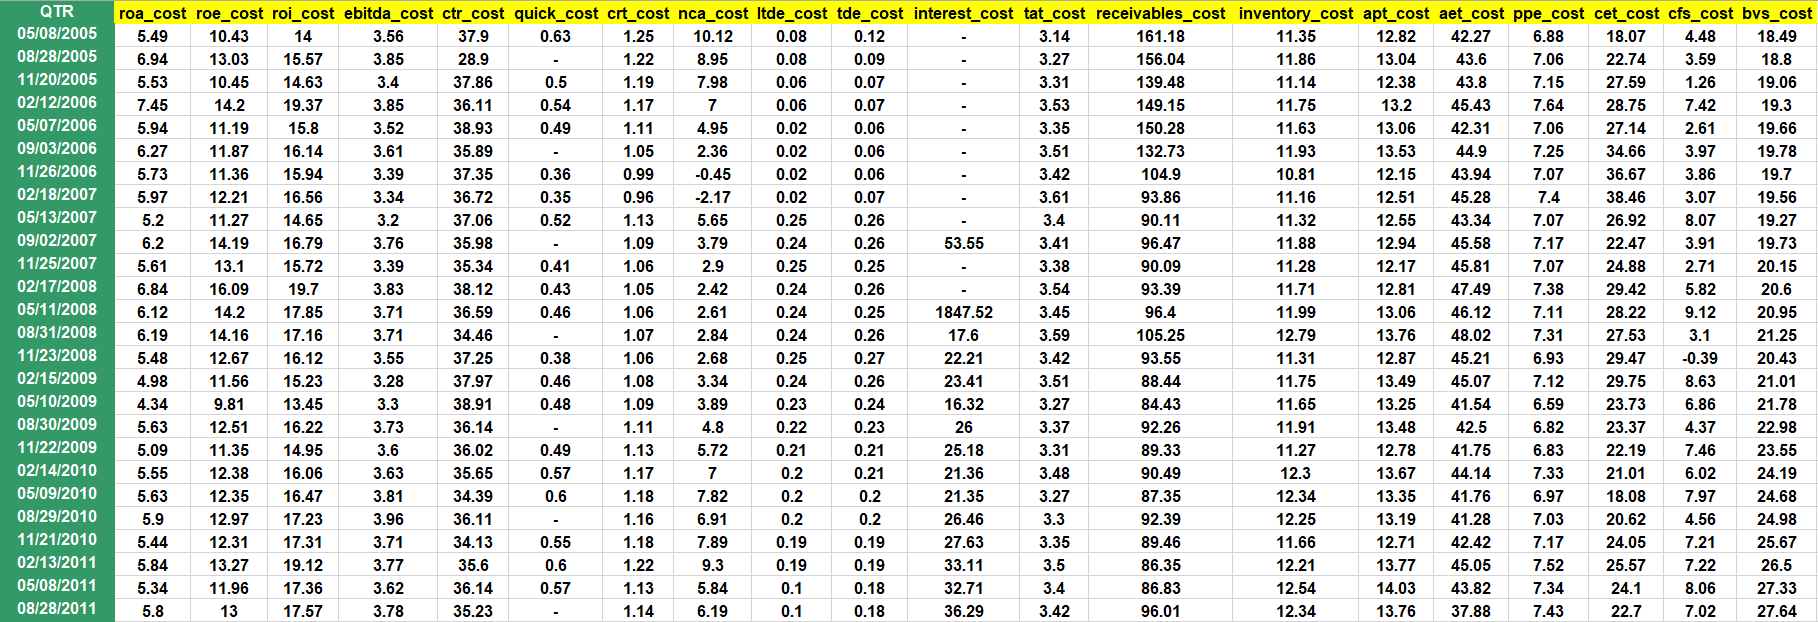
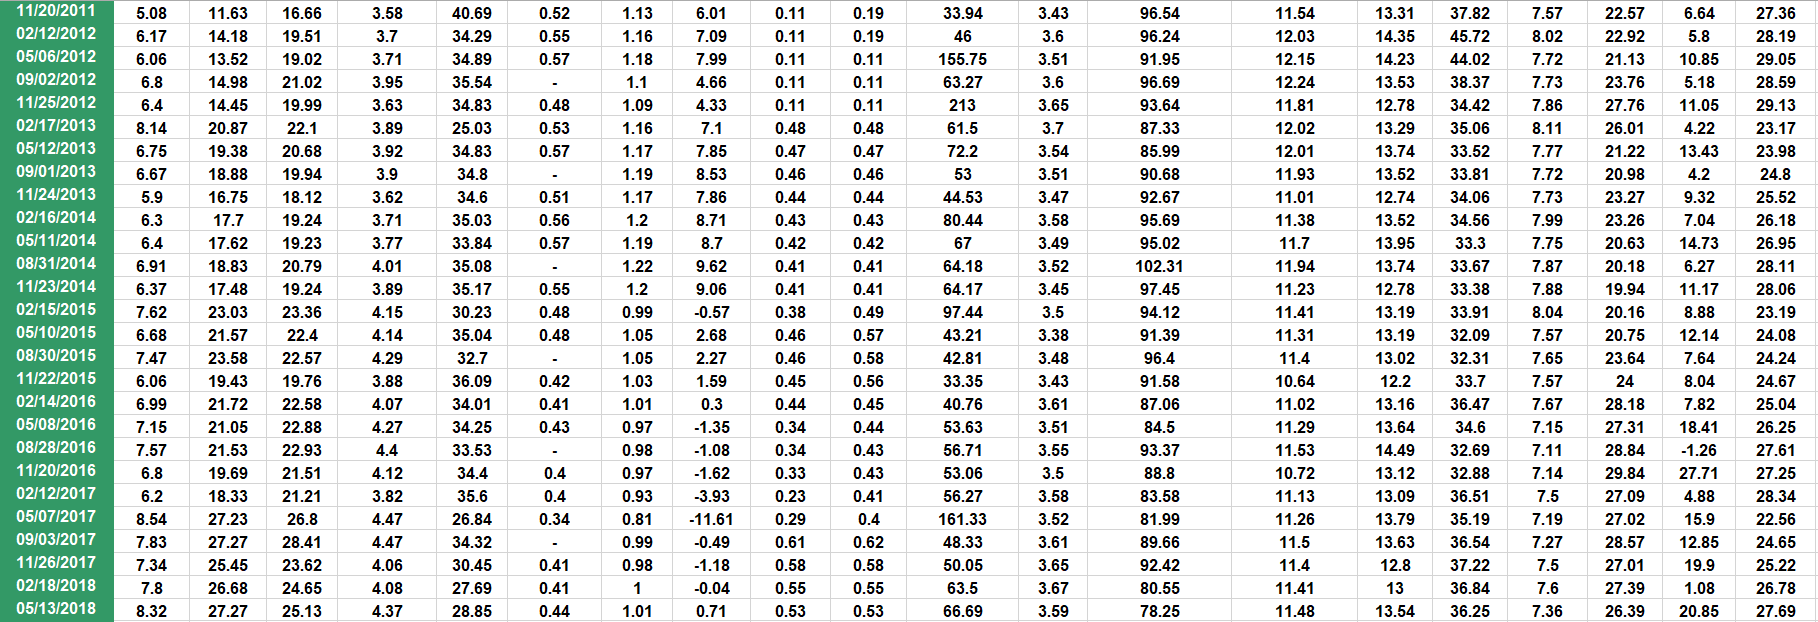
1. Financial Analysis/Analysis of the Financial Ratios : From the data provided below, you are to select seven (7) ratios for the company. The file
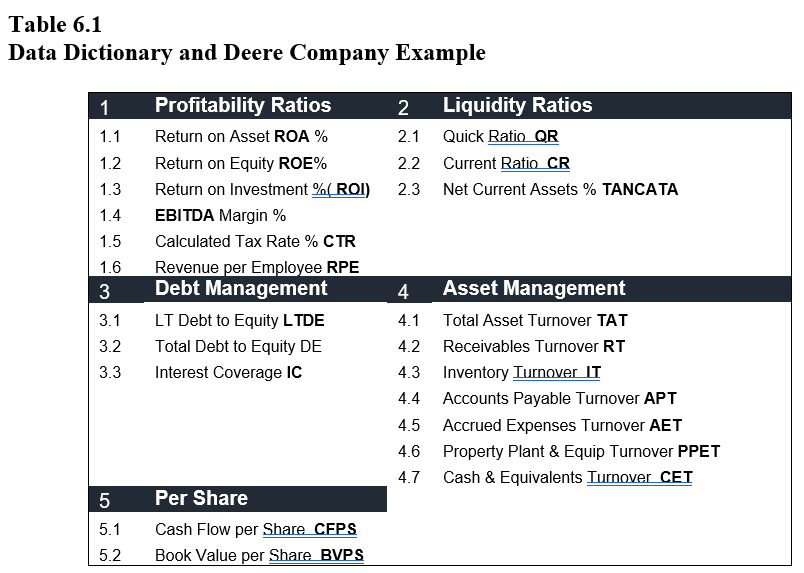
1. Financial Analysis/Analysis of the Financial Ratios: From the data provided below, you are to select seven (7) ratios for the company. The file contains names of Public Companies and relevant ratios. The variables (or series) in the sheet contains the same series, in quarterly data. You want to note the start and end dates of each series. Table 6.1 below provides a list of all ratio series in the file along with their name. You want to note there may be missing data or limited for some series.

While developing an analysis of financial ratios, you should develop several relevant graphs using the dataset available to you where you explain the recent evolution of the corresponding ratios. You are to analyze your graphs with respect to: Seasonal Adjustment, Long-Term Trend, Structural Breaks
2. Regression analysis: You will need to import the data into Stata. Please be careful with negative values in this process. You may need to use the encode command. See the example below:

You only need to develop a regression model for one company. The regression problem requires you to understand how to develop a regression model and the steps that produce a model of best fit, model that best fits the data. We covered a number of these topics during the review period. Instructions are as follows:
- Choose one (1) variable to represent the dependent variable.
- Choose 7 variables you feel would be good predictors of the dependent variable. The choice of variables determines your regression model. The model for your regression should be defined in a specification using your selected variables in place of the y and xs. Next, the regression results presented in the model with the estimated regression parameters. Finally, your discussion of the estimated regression with an interpretation of the regression results.[1]
- You will develop a multiple regression model using the ratio data.
- Again, the multivariate regression model should include specification of the model, a discussion of the relation of each independent variable to the dependent variable, and a detailed discussion of the follow diagnostic tests:
- p-value of each coefficient, including the intercept term.
- r- and adjusted r-square.
- F-stat and its pvalue; and the
- Durbin Watson statistic, in addition to
- testing for multicollinearity
- serial or autocorrelation and
- heteroskedasticity (the last two using tests from residuals in Stata; that is, the Serial Correlation Test for autocorrelation and Whites test for heteroskedasticity. Both are one-tailed F- and chi-square tests so you want to review your stats text for interpretation of these distributions. Recall, it is assumed that you know most of the above stats; however, the tests for autocorrelation and heteroskedasticity are introduced in this course.
3. Univariate Forecasting Models
Finally, a short section with the development of the Univariate Forecasting Model. You will first choose one of the profitability ratios, test for unit roots, and display in-of-sample and out-of-sample forecasts.
Company Data Sheet:


Step by Step Solution
There are 3 Steps involved in it
Step: 1

Get Instant Access to Expert-Tailored Solutions
See step-by-step solutions with expert insights and AI powered tools for academic success
Step: 2

Step: 3

Ace Your Homework with AI
Get the answers you need in no time with our AI-driven, step-by-step assistance
Get Started


