. Find the mean, variance, and standard deviation for the probability density function f (x) = 0.1.0 x 10. Graph the probability density function,


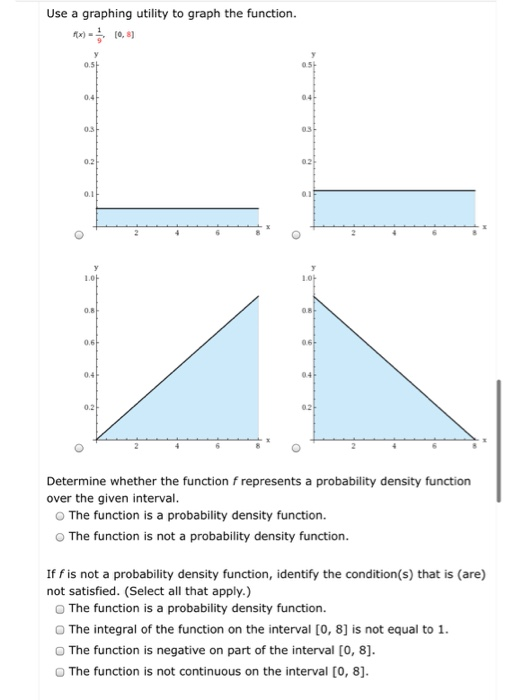
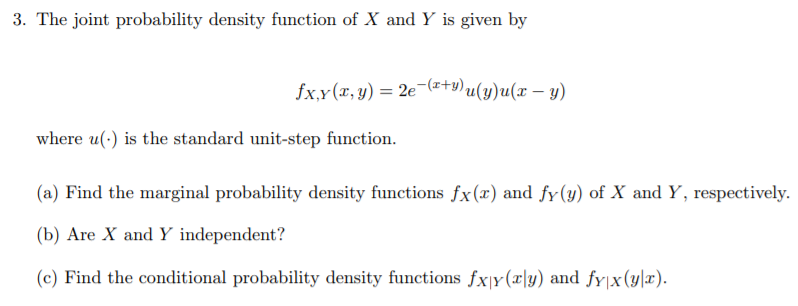
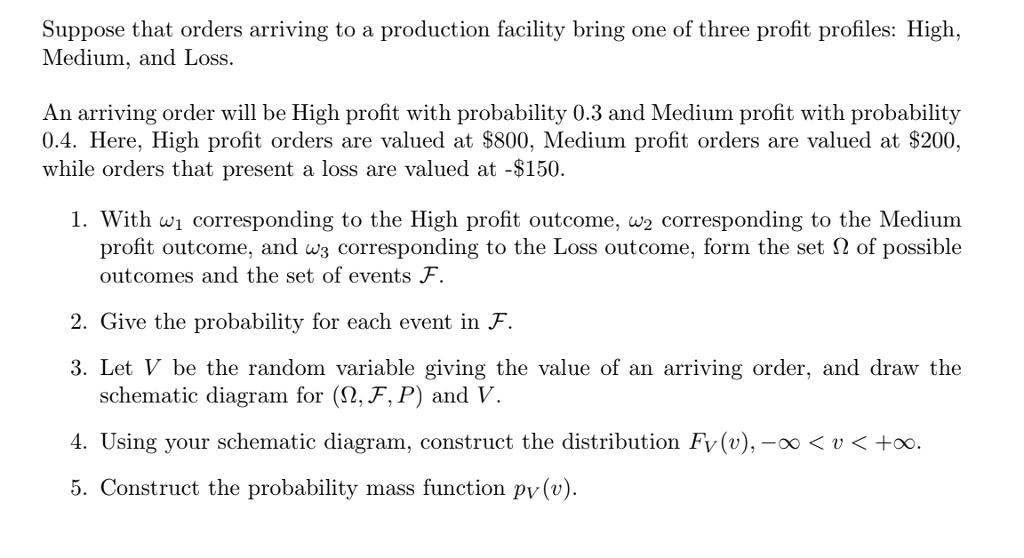
. Find the mean, variance, and standard deviation for the probability density function f (x) = 0.1.0 x 10. Graph the probability density function, then find and graph the cumulative distribution function on the same axes. 2. Find the mean, variance, and standard deviation for the probability density function f(x) = e.0 < x. Graph the probability density function, then find and graph the cumulative distribution function on the same axes. 3. Find the mean, variance, and standard deviation for the probability density function. f (x) = 1.5.-1x 1. Graph the probability density function, then find and graph the cumulative distribution function on the same axes. Use a graphing utility to graph the function. f(x) = (0,8) 0.5 0.4 0.3 0.2 0.1 1.04 0.8 0.6 0.4 0.2 04 0.3 0.1 1.0 0.8 0.6 04 02 Determine whether the function f represents a probability density function over the given interval. The function is a probability density function. The function is not a probability density function. If f is not a probability density function, identify the condition(s) that is (are) not satisfied. (Select all that apply.) The function is a probability density function. The integral of the function on the interval [0, 8] is not equal to 1. The function is negative on part of the interval [0, 8]. The function is not continuous on the interval [0, 8]. 3. The joint probability density function of X and Y is given by fx,y(x, y) = 2e(x+y)u(y)u(x y) where u() is the standard unit-step function. (a) Find the marginal probability density functions fx(x) and fy (y) of X and Y, respectively. (b) Are X and Y independent? (c) Find the conditional probability density functions fx y(rly) and fy|x(y|x). Suppose that orders arriving to a production facility bring one of three profit profiles: High, Medium, and Loss. An arriving order will be High profit with probability 0.3 and Medium profit with probability 0.4. Here, High profit orders are valued at $800, Medium profit orders are valued at $200, while orders that present a loss are valued at -$150. 1. With w corresponding to the High profit outcome, w2 corresponding to the Medium profit outcome, and w3 corresponding to the Loss outcome, form the set of possible outcomes and the set of events F. 2. Give the probability for each event in F. 3. Let V be the random variable giving the value of an arriving order, and draw the schematic diagram for (N, F, P) and V. 4. Using your schematic diagram, construct the distribution Fy(v),
Step by Step Solution
3.52 Rating (159 Votes )
There are 3 Steps involved in it
Step: 1
For the probability density function fx 01 0 x 10 Mean The mean of a continuous uniform distribution is given by the formula a b 2 where a and b are t...
See step-by-step solutions with expert insights and AI powered tools for academic success
Step: 2

Step: 3

Ace Your Homework with AI
Get the answers you need in no time with our AI-driven, step-by-step assistance
Get Started


