Answered step by step
Verified Expert Solution
Question
1 Approved Answer
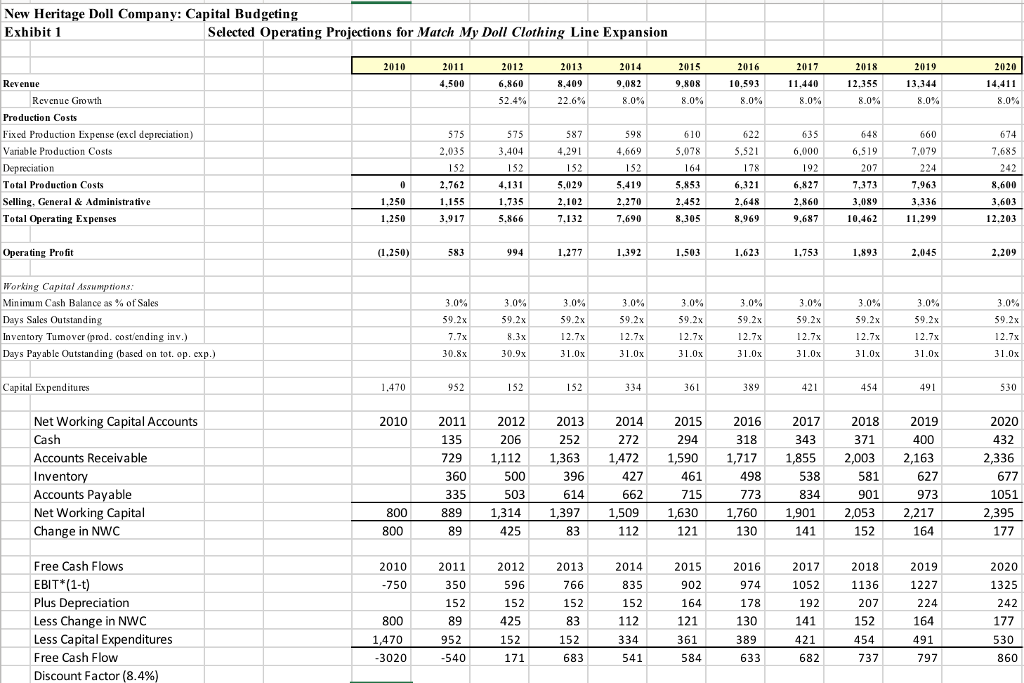
1. Find the NPV with the terminal value and the NPV without the terminal value (g = 3%, WACC = 8.4%) PLEASE SHOW WORK New

1. Find the NPV with the terminal value and the NPV without the terminal value (g = 3%, WACC = 8.4%) PLEASE SHOW WORK
New Heritage Doll Company: Capital Budgeting Exhibit 1 Selected Operating Projections for Match My Doll Clothing Line Expansion 2020 4.500 6.860 8.409 9.082 9.808 10.593 11.440 12.355 13.344 14.411 Revenuc Growth 8.0% 8.0% Production Costs Fixed Production Expense (excl depreciation) Variable Production Costs 4,291 6,000 reciation Total Production Costs Selling. General & Administrative Total Operating Expenses 8,600 3.603 12.203 2.762 2.270 1.250 5.866 8.305 8,969 10.462 11.299 Operating Profit 994 1.277 1.753 Working Capital Assumptions Minimum Cash Balance as % of Sales Days Sales Outstandin Inventory Tumover (prod. costending inv.) Days Payable Outstanding (based on tot. op. cxp.) Capital Expenditures 2010 2016 318 2018 2019 2012 206 2013 252 2014 272 2015 2017 2020 432 Net Working Capital Accounts Cash Accounts Receivable Invento Accounts Pavable Net Working Capital Change in NWC 2011 135 729 1,112 ,363 1472 1,590 1,717 1,855 2,003 2,163 396 614 1,397 427 662 1,509 498 773 627 973 2,217 538 677 1051 2,395 503 335 889 1,630 1,901 2,053 Free Cash Flows EBIT (1-t Plus Depreciation Less Change in NWC Less Capital Expenditures Free Cash Flow Discount Factor (8.4%) 2011 2012 2013 2014 2015 902 2016 2019 1227 2017 2020 1052 1136 1325 3020 860 New Heritage Doll Company: Capital Budgeting Exhibit 1 Selected Operating Projections for Match My Doll Clothing Line Expansion 2020 4.500 6.860 8.409 9.082 9.808 10.593 11.440 12.355 13.344 14.411 Revenuc Growth 8.0% 8.0% Production Costs Fixed Production Expense (excl depreciation) Variable Production Costs 4,291 6,000 reciation Total Production Costs Selling. General & Administrative Total Operating Expenses 8,600 3.603 12.203 2.762 2.270 1.250 5.866 8.305 8,969 10.462 11.299 Operating Profit 994 1.277 1.753 Working Capital Assumptions Minimum Cash Balance as % of Sales Days Sales Outstandin Inventory Tumover (prod. costending inv.) Days Payable Outstanding (based on tot. op. cxp.) Capital Expenditures 2010 2016 318 2018 2019 2012 206 2013 252 2014 272 2015 2017 2020 432 Net Working Capital Accounts Cash Accounts Receivable Invento Accounts Pavable Net Working Capital Change in NWC 2011 135 729 1,112 ,363 1472 1,590 1,717 1,855 2,003 2,163 396 614 1,397 427 662 1,509 498 773 627 973 2,217 538 677 1051 2,395 503 335 889 1,630 1,901 2,053 Free Cash Flows EBIT (1-t Plus Depreciation Less Change in NWC Less Capital Expenditures Free Cash Flow Discount Factor (8.4%) 2011 2012 2013 2014 2015 902 2016 2019 1227 2017 2020 1052 1136 1325 3020 860Step by Step Solution
There are 3 Steps involved in it
Step: 1

Get Instant Access to Expert-Tailored Solutions
See step-by-step solutions with expert insights and AI powered tools for academic success
Step: 2

Step: 3

Ace Your Homework with AI
Get the answers you need in no time with our AI-driven, step-by-step assistance
Get Started


