Question
1. Focusing on only the inpatient care cost (i.e., ignoring operating room costs), what is the cost of a TAH (non-oncology) under each of the
1. Focusing on only the inpatient care cost (i.e., ignoring operating room costs), what is the cost of a TAH (non-oncology) under each of the cost accounting systems? A tuboplasty? A TAH (oncology)? What accounts for the differences?,
2. Which of the three systems is the best? Why?
3.From a managerial perspective, of what use is the information in the second and third systems? How, if at all, would this additional information improve Dr. Julian’s ability to control costs? How might it help chiefs in non-surgical specialties?
4.What should Dr. Julian do next?
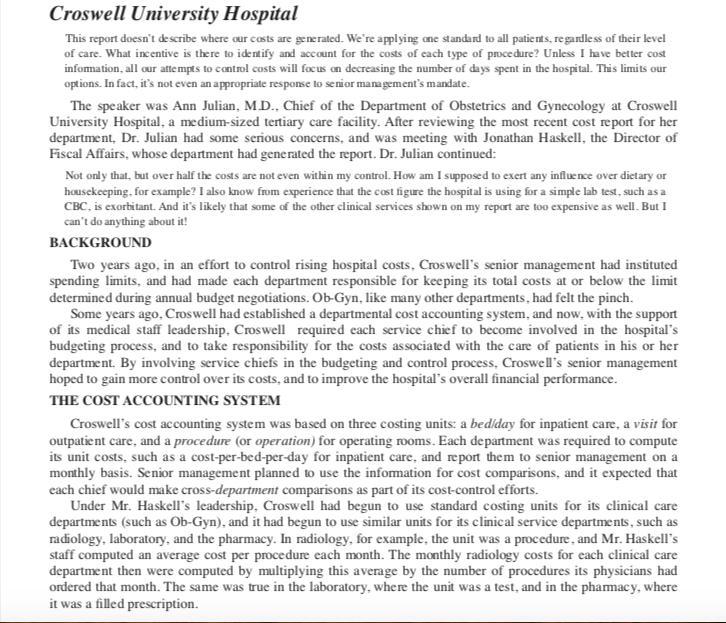
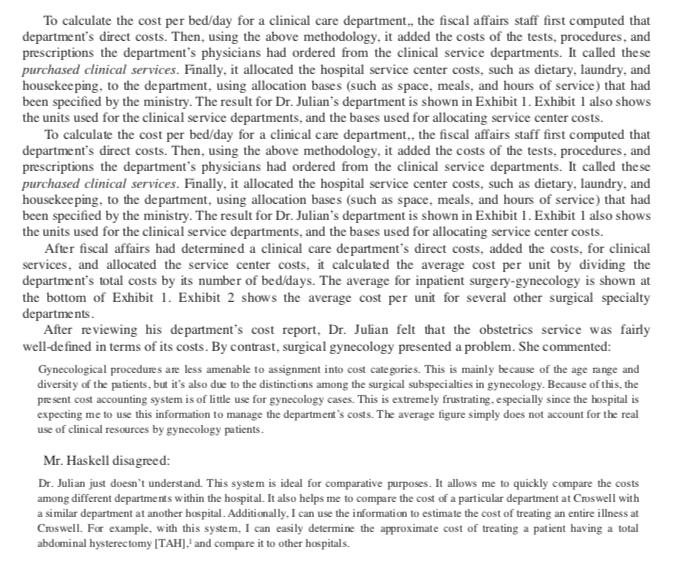


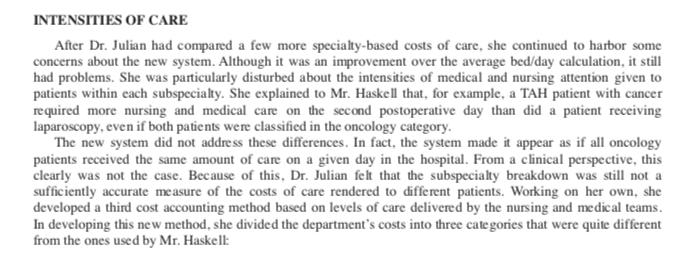
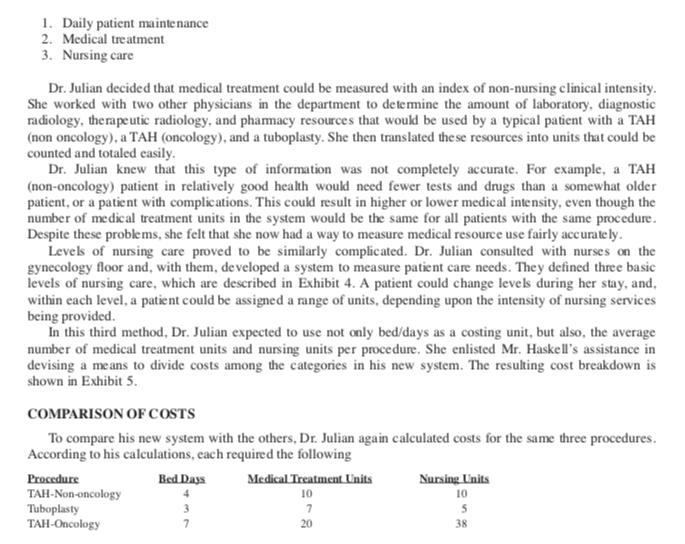
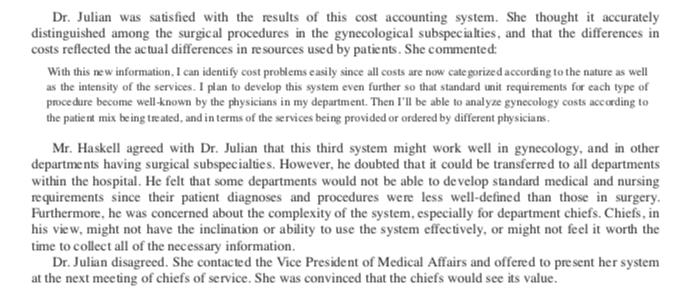
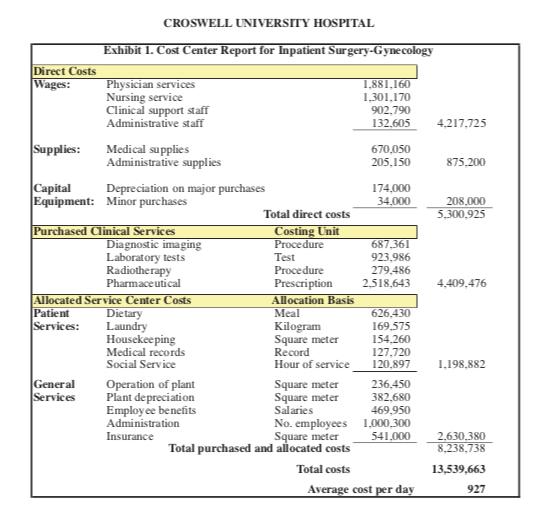
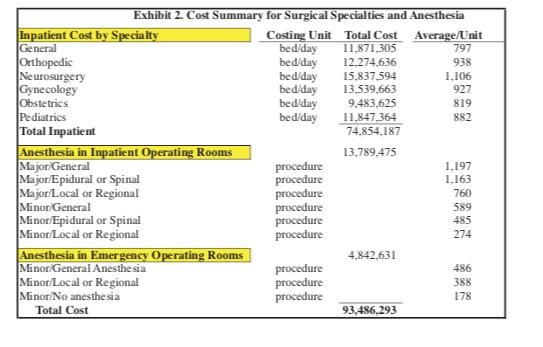
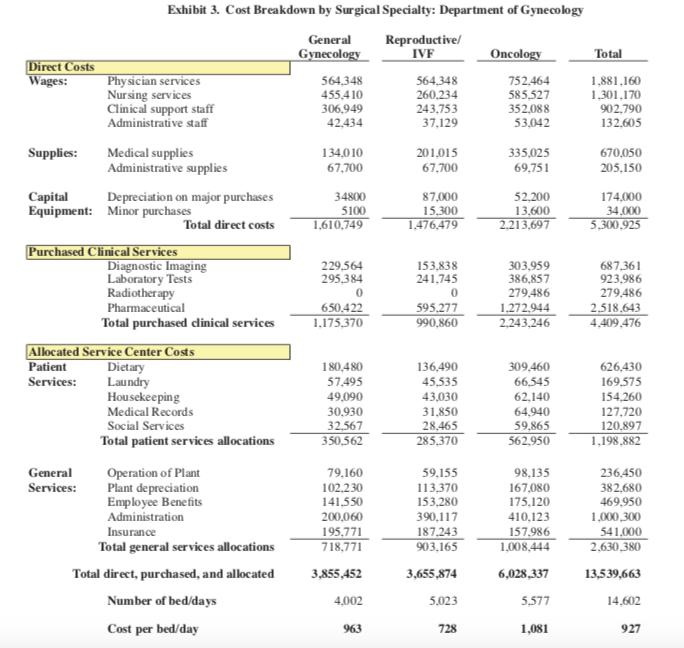
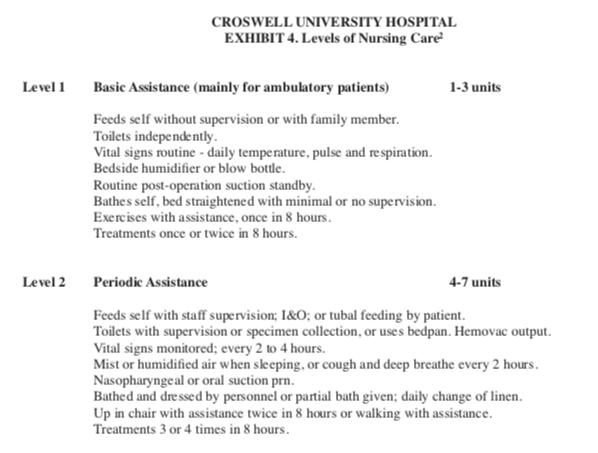
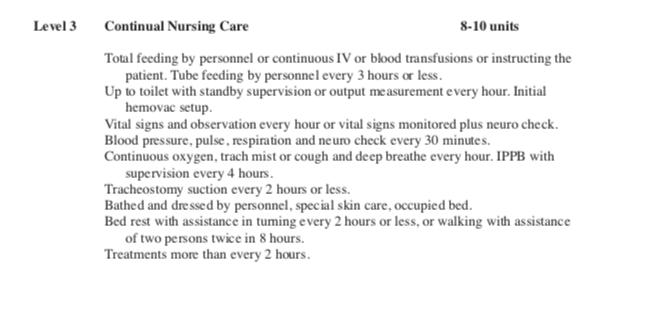
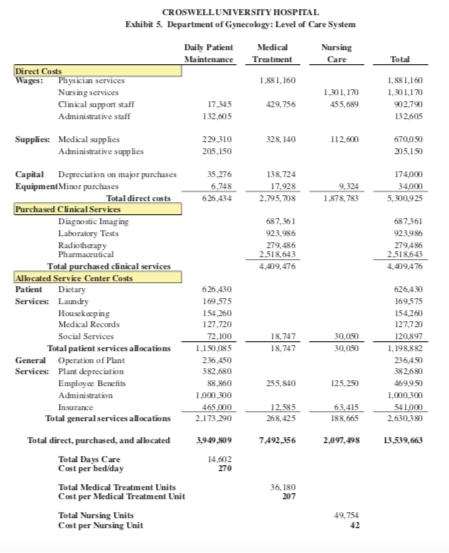
Croswell University Hospital This report doesn t describe where our costs are generated. We re applying one standard to all patients, regardless of their level of care. What incentive is there to identify and account for the costs of each type of procedure? Unless I have better cost information, all our attempts to control costs will focus on decreasing the number of days spent in the hospital. This limits our options. In fact, it s not even an appropriate response to senior management s mandate. The speaker was Ann Julian, M.D., Chief of the Department of Obstetrics and Gynecology at Croswell University Hospital, a medium-sized tertiary care facility. After reviewing the most recent cost report for her department, Dr. Julian had some serious concerns, and was meeting with Jonathan Haskell, the Director of Fiscal Affairs, whose department had generated the report. Dr. Julian continued: Not only that, but over half the costs are not even within my control. How am I supposed to exert any influence over dietary or housekeeping, for example? I also know from experience that the cost figure the hospital is using for a simple lab test, such as a CBC, is exorbitant. And it s likely that some of the other clinical services shown on my report are too expensive as well. But I can t do anything about it! BACKGROUND Two years ago, in an effort to control rising hospital costs, Croswell s senior management had instituted spending limits, and had made each department responsible for keeping its total costs at or below the limit determined during annual budget negotiations. Ob-Gyn, like many other departments, had felt the pinch. Some years ago, Croswell had established a departmental cost accounting system, and now, with the support of its medical staff leadership, Croswell required each service chief to become involved in the hospital s budgeting process, and to take responsibility for the costs associated with the care of patients in his or her department. By involving service chiefs in the budgeting and control process, Croswell s senior management hoped to gain more control over its costs, and to improve the hospital s overall financial performance. THE COST ACCOUNTING SYSTEM Croswell s cost accounting system was based on three costing units: a bed/day for inpatient care, a visit for outpatient care, and a procedure (or operation) for operating rooms. Each department was required to compute its unit costs, such as a cost-per-bed-per-day for inpatient care, and report them to senior management on a monthly basis. Senior management planned to use the information for cost comparisons, and it expected that each chief would make cross-department comparisons as part of its cost-control efforts. Under Mr. Haskell s leadership, Croswell had begun to use standard costing units for its clinical care departments (such as Ob-Gyn), and it had begun to use similar units for its clinical service departments, such as radiology, laboratory, and the pharmacy. In radiology, for example, the unit was a procedure, and Mr. Haskell s staff computed an average cost per procedure each month. The monthly radiology costs for each clinical care department then were computed by multiplying this average by the number of procedures its physicians had ordered that month. The same was true in the laboratory, where the unit was a test, and in the pharmacy, where it was a filled prescription. To calculate the cost per bed/day for a clinical care department, the fiscal affairs staff first computed that department s direct costs. Then, using the above methodology, it added the costs of the tests, procedures, and prescriptions the department s physicians had ordered from the clinical service departments. It called the se purchased clinical services. Finally, it allocated the hospital service center costs, such as dietary, laundry, and housekeeping, to the department, using allocation bases (such as space, meals, and hours of service) that had been specified by the ministry. The result for Dr. Julian s department is shown in Exhibit 1. Exhibit 1 also shows the units used for the clinical service departments, and the bases used for allocating service center costs. To calculate the cost per bed/day for a clinical care department., the fiscal affairs staff first computed that department s direct costs. Then, using the above methodology, it added the costs of the tests, procedures, and prescriptions the department s physicians had ordered from the clinical service departments. It called these purchased clinical services. Finally, it allocated the hospital service center costs, such as dietary, laundry, and housekeeping, to the department, using allocation bases (such as space, meals, and hours of service) that had been specified by the ministry. The result for Dr. Julian s department is shown in Exhibit 1. Exhibit 1 also shows the units used for the clinical service departments, and the bases used for allocating service center costs. After fiscal affairs had determined a clinical care department s direct costs, added the costs, for clinical services, and allocated the service center costs, it calculated the average cost per unit by dividing the department s total costs by its number of bed/days. The average for inpatient surgery-gynecology is shown at the bottom of Exhibit 1. Exhibit 2 shows the average cost per unit for several other surgical specialty departments. After reviewing his department s cost report, Dr. Julian felt that the obstetrics service was fairly well-defined in terms of its costs. By contrast, surgical gynecology presented a problem. She commented: Gynecological procedures are less amenable to assignment into cost categories. This is mainly because of the age range and diversity of the patients, but it s also due to the distinctions among the surgical subspecialties in gynecology. Because of this, the present cost accounting system is of little use for gynecology cases. This is extremely frustrating, especially since the hospital is expecting me to use this information to manage the department s costs. The average figure simply does not account for the real use of clinical resources by gynecology patients. Mr. Haskell disagreed: Dr. Julian just doesn t understand. This system is ideal for comparative purposes. It allows me to quickly compare the costs among different departments within the hospital. It also helps me to compare the cost of a particular department at Croswell with a similar department at another hospital. Additionally, I can use the information to estimate the cost of treating an entire illness at Croswell. For example, with this system, I can easily determine the approximate cost of treating a patient having a total abdominal hysterectomy [TAH], and compare it to other hospitals. According to Mr. Haskell s figures, the cost of a non-oncology TAH (which usually required four days in the hospital) was 3,708 (927 x 4). To this would be added the cost of a major operation with general anesthesia, or 1,197. (The procedure might also be performed with epidural or spinal anesthesia at the discretion of the attending physician and the anesthesia staff, in which case the total cost of the procedure would be slightly less.) The inpatient operating room costs were based on a two-year study, and the figures were updated regularly by the fiscal affairs department. At present. Dr. Julian was not held accountable for these costs, nor for the costs of anesthesia management. She was responsible only for the costs associated with the pre- and postoperative care of the patients in his department. These costs were the ones causing her difficulty. She continued: Some patients, especially those undergoing treatment for cancer, use more resources than others. This is mainly because the testing and therapeutic treatment of patients varies widely. Some patients require more or fewer diagnostic and therapeutic interventions, depending on their admitting diagnoses. For example, radiation therapy is used almost exclusively by oncology patients. Somehow, a good cost accounting system needs to recognize these differences. I also don t want my department to appear overly costly simply because some patients don t conform to the norm. The current cost accounting system just doesn t account for the differences among patients. As a result, it doesn t give me the data I need to manage costs, and it includes a variety of items that I can t control. THE USE OF CLINICAL DISTINCTIONS After some discussion, Dr. Julian convinced Mr. Haskell that the average unit cost calculation could be revised to account for the differences among patients having different gynecology procedures. In an effort to address these clinical differences. The two decided that gynecology patients could be divided into three categories according to clinical subspecialty: 1. General gynecology/urogynecology (non-oncology) 2. Reproductive/invitro fertilization 3. Oncology With the help of Dr. Julian, Mr. Haskell calculated time and material estimates for each type of patient stay. For example, he estimated that, in general, more medication was used on oncology patients than on general gynecology patients. Also, oncology patients were likely to need more of a variety of other resources, such as lab tests, drugs, and x-rays. Mr. Haskell conferred with his staff about the best method to apportion the department s costs among the three subspecialties. After much discussion, they decided to apportion most of them according to the number of patient days per subspecialty. They made some adjustments, however, to reflect unusual circumstances. The results are shown in Exhibit 3. Dr. Julian and Mr. Haskell performed some calculations and compared the differences between the two systems. They first computed the cost of a non-oncology TAH using each system. Dr. Julian noted that the procedure generally took place in the general gynecology category. They then compared the costs of patients undergoing two other procedures. One was a tuboplasty, a procedure in which the fallopian tube is opened or its lumen (passage) is reestablished. The other was a TAH with lymph node dissection. In this operation, the lymph nodes in the pelvic region are excised. The tuboplasty would take place in the Reproductive-IVF category, while the TAH with lymph node dissection ordinarily would be classified in the oncology category. Although this new system maintained bed/days as the costing unit, Mr. Haskell concluded that it was more accurate than the current one because there were now three average costs per bed/day: one for general gynecology/urogynecology, another for Reproductive-IVF, and a third for oncology. Dr. Julian and Mr. Haskell concluded that this specialty-based system could greatly increase Dr. Julian s ability to control costs. INTENSITIES OF CARE After Dr. Julian had compared a few more specialty-based costs of care, she continued to harbor some concerns about the new system. Although it was an improvement over the average bed/day calculation, it still had problems. She was particularly disturbed about the intensities of medical and nursing attention given to patients within each subspecialty. She explained to Mr. Haskell that, for example, a TAH patient with cancer required more nursing and medical care on the second postoperative day than did a patient receiving laparoscopy, even if both patients were classified in the oncology category. The new system did not address these differences. In fact, the system made it appear as if all oncology patients received the same amount of care on a given day in the hospital. From a clinical perspective, this clearly was not the case. Because of this, Dr. Julian felt that the subspecialty breakdown was still not a sufficiently accurate measure of the costs of care rendered to different patients. Working on her own, she developed a third cost accounting method based on levels of care delivered by the nursing and medical teams. In developing this new method, she divided the department s costs into three categories that were quite different from the ones used by Mr. Haskell: 1. Daily patient maintenance 2. Medical treatment 3. Nursing care Dr. Julian decided that medical treatment could be measured with an index of non-nursing clinical intensity. She worked with two other physicians in the department to determine the amount of laboratory, diagnostic radiology, therapeutic radiology, and pharmacy resources that would be used by a typical patient with a TAH (non oncology), a TAH (oncology), and a tuboplasty. She then translated these resources into units that could be counted and totaled easily. Dr. Julian knew that this type of information was not completely accurate. For example, a TAH (non-oncology) patient in relatively good health would need fewer tests and drugs than a somewhat older patient, or a patient with complications. This could result in higher or lower medical intensity, even though the number of medical treatment units in the system would be the same for all patients with the same procedure. Despite these problems, she felt that she now had a way to measure medical resource use fairly accurately. Levels of nursing care proved to be similarly complicated. Dr. Julian consulted with nurses on the gynecology floor and, with them, developed a system to measure patient care needs. They defined three basic levels of nursing care, which are described in Exhibit 4. A patient could change levels during her stay, and, within each level, a patient could be assigned a range of units, depending upon the intensity of nursing services being provided. In this third method, Dr. Julian expected to use not only bed/days as a costing unit, but also, the average number of medical treatment units and nursing units per procedure. She enlisted Mr. Haskell s assistance in devising a means to divide costs among the categories in his new system. The resulting cost breakdown is shown in Exhibit 5. COMPARISON OF COSTS To compare his new system with the others, Dr. Julian again calculated costs for the same three procedures. According to his calculations, each required the following Procedure TAH-Non-oncology Tuboplasty TAH-Oncology Bed Days 4 3 7 Medical Treatment Units 10 7 20 Nursing Units 10 5 38 Dr. Julian was satisfied with the results of this cost accounting system. She thought it accurately distinguished among the surgical procedures in the gynecological subspecialties, and that the differences in costs reflected the actual differences in resources used by patients. She commented: With this new information, I can identify cost problems easily since all costs are now categorized according to the nature as well as the intensity of the services. I plan to develop this system even further so that standard unit requirements for each type of procedure become well-known by the physicians in my department. Then I ll be able to analyze gynecology costs according to the patient mix being treated, and in terms of the services being provided or ordered by different physicians. Mr. Haskell agreed with Dr. Julian that this third system might work well in gynecology, and in other departments having surgical subspecialties. However, he doubted that it could be transferred to all departments within the hospital. He felt that some departments would not be able to develop standard medical and nursing requirements since their patient diagnoses and procedures were less well-defined than those in surgery. Furthermore, he was concerned about the complexity of the system, especially for department chiefs. Chiefs, in his view, might not have the inclination or ability to use the system effectively, or might not feel it worth the time to collect all of the necessary information. Dr. Julian disagreed. She contacted the Vice President of Medical Affairs and offered to present her system at the next meeting of chiefs of service. She was convinced that the chiefs would see its value. Direct Costs Wages: Supplies: CROSWELL UNIVERSITY HOSPITAL Exhibit 1. Cost Center Report for Inpatient Surgery-Gynecology Physician services Nursing service Clinical support staff Administrative staff General Services Medical supplies Administrative supplies Capital Depreciation on major purchases Equipment: Minor purchases Purchased Clinical Services Diagnostic imaging Laboratory tests Radiotherapy Pharmaceutical Allocated Service Center Costs Patient Dietary Services: Laundry Housekeeping Medical records Social Service Operation of plant Plant depreciation Employee benefits Administration Insurance Total direct costs Costing Unit Procedure Test Procedure Prescription Allocation Basis Meal Kilogram Square meter Record Hour of service Square meter Square meter Salaries No. employees Square meter Total purchased and allocated costs Total costs 1,881,160 1,301,170 902,790 132,605 670,050 205,150 174,000 34,000 687,361 923,986 279,486 2,518,643 626,430 169.575 154,260 127,720 120,897 236.450 382.680 469.950 1,000,300 541,000 Average cost per day 4,217,725 875.200 208,000 5,300,925 4,409,476 1.198,882 2.630,380 8,238,738 13,539,663 927 Exhibit 2. Cost Summary for Surgical Specialties and Anesthesia Costing Unit Total Cost bed/day 11,871,305 bed/day 12,274,636 bed/day 15,837,594 bed/day 13,539,663 9,483,625 Inpatient Cost by Specialty General Orthopedic Neurosurgery Gynecology Obstetrics Pediatrics Total Inpatient Anesthesia in Inpatient Operating Rooms Major General Major/Epidural or Spinal Major/Local or Regional Minor General Minor/Epidural or Spinal Minor/Local or Regional Anesthesia in Emergency Operating Rooms Minor/General Anesthesia Minor/Local or Regional Minor/No anesthesia Total Cost bed/day bed/day procedure procedure procedure procedure procedure procedure procedure procedure procedure 11,847,364 74,854.187 13,789,475 4,842,631 93,486,293 Average/Unit 797 938 1.106 927 819 882 1,197 1.163 760 589 485 274 486 388 178 Direct Costs Wages: Supplies: Exhibit 3. Cost Breakdown by Surgical Specialty: Department of Gynecology General Gynecology Physician services Nursing services Clinical support staff Administrative staff Medical supplies Administrative supplies Capital Equipment: Minor purchases General Services: Depreciation on major purchases Total direct costs Purchased Clinical Services Diagnostic Imaging Laboratory Tests Radiotherapy Pharmaceutical Total purchased clinical services Allocated Service Center Costs Patient Services: Dietary Laundry Housekeeping Medical Records Social Services Total patient services allocations Operation of Plant Plant depreciation Employee Benefits Administration Insurance Total general services allocations Total direct, purchased, and allocated Number of bed/days Cost per bed/day 564,348 455,410 306.949 42,434 134,010 67,700 34800 5100 1,610,749 229,564 295,384 0 650,422 1.175,370 180,480 57,495 49,090 30,930 32.567 350,562 79,160 102,230 141,550 200,060 195,771 718,771 3,855,452 4,002 963 Reproductive/ IVF 564,348 260.234 243,753 37,129 201,015 67,700 87,000 15,300 1.476,479 153,838 241,745 0 595,277 990,860 136,490 45,535 43,030 31,850 28,465 285,370 59.155 113,370 153,280 390,117 187.243 903.165 3,655,874 5,023 728 Oncology 752,464 585,527 352,088 53,042 335,025 69,751 52,200 13,600 2.213,697 303,959 386,857 279,486 1,272,944 2,243,246 309,460 66,545 62,140 64,940 59,865 562,950 98,135 167,080 175,120 410,123 157,986 1,008,444 6,028,337 5,577 1,081 Total 1,881,160 1,301,170 902,790 132,605 670,050 205,150 174,000 34,000 5,300,925 687,361 923,986 279,486 2,518,643 4,409,476 626,430 169,575 154,260 127,720 120,897 1,198,882 236,450 382,680 469,950 1,000,300 541,000 2,630,380 13,539,663 14,602 927 Level 1 Level 2 CROSWELL UNIVERSITY HOSPITAL EXHIBIT 4. Levels of Nursing Care Basic Assistance (mainly for ambulatory patients) Feeds self without supervision or with family member. Toilets independently.. Vital signs routine - daily temperature, pulse and respiration. Bedside humidifier or blow bottle. Routine post-operation suction standby. Bathes self, bed straightened with minimal or no supervision. Exercises with assistance, once in 8 hours. Treatments once or twice in 8 hours. 1-3 units Periodic Assistance Feeds self with staff supervision; 1&O; or tubal feeding by patient. Toilets with supervision or specimen collection, or uses bedpan. Hemovac output. Vital signs monitored; every 2 to 4 hours. Mist or humidified air when sleeping, or cough and deep breathe every 2 hours. Nasopharyngeal or oral suction prn. Bathed and dressed by personnel or partial bath given; daily change of linen. 4-7 units Up in chair with assistance twice in 8 hours or walking with assistance. Treatments 3 or 4 times in 8 hours. Level 3 Continual Nursing Care Total feeding by personnel or continuous IV or blood transfusions or instructing the patient. Tube feeding by personnel every 3 hours or less. Up to toilet with standby supervision or output measurement every hour. Initial hemovac setup. Vital signs and observation every hour or vital signs monitored plus neuro check. Blood pressure, pulse, respiration and neuro check every 30 minutes. Continuous oxygen, trach mist or cough and deep breathe every hour. IPPB with supervision every 4 hours. Tracheostomy suction every 2 hours or less. Bathed and dressed by personnel, special skin care, occupied bed. Bed rest with assistance in tuming every 2 hours or less, or walking with assistance of two persons twice in 8 hours. Treatments more than every 2 hours. 8-10 units Direct Costs Wages: Physician services Nursing services Clinical support staff Administrative staff Supplies Medical supplies CROSWELL UNIVERSITY HOSPITAL Exhibit 5. Department of Gynecology: Level of Care System Administrative supplies Capital Depreciation on major purchases Equipment Minor purchases Total direct costs Purchased Clinical Services Diagnostic Imaging Laboratory Tests Radiotherapy Pharmaceutical Total purchased clinical services Allocated Service Center Costs Patient Dietary Services: Laundry Housekeeping Medical Records Social Services Total patient services allocations General Operation of Plant Services: Plant depreciation Employee Benefits Administration Insurance Total general services allocations Total direct, purchased, and allocated Total Days Care Cost per bediday Daily Patient Maintenance Total Medical Treatment Units Cost per Medical Treatment Unit Total Nursing Units Cost per Nursing Unit 17,345 132,605 229.310 205,150 35,276 6,748 626,430 169,575 154,360 127,720 72,100 1,150,085 236,450 382,680 88,860 1,000,300 465.000 2.173.290 3,949,509 14,602 270 Medical Treatment 1,881,160 429,756 328,140 138,724 17,928 2,795,708 687,361 923,986 279,486 2.518,643 4,409,476 18,747 18,747 255,840 12.585 268,425 7.492,356 36,180 207 Nursing Care 1,301,170 455,689 112,600 9,324 1,878,783 30,050 30,050 125.250 63.415 188,665 2,097,498 49,754 42 Total 1,881,160 1,301,170 902,790 132.605 670,050 205,150 174,000 34,000 5,300,925 687,361 923,986 279,486 2518643 4,409,476 626,430 169,575 154260 127,730 120,897 1.198,882 236,450 382.680 469,950 1,000,300 541,000 2,630,380 13,539,663
Step by Step Solution
3.30 Rating (150 Votes )
There are 3 Steps involved in it
Step: 1

Get Instant Access to Expert-Tailored Solutions
See step-by-step solutions with expert insights and AI powered tools for academic success
Step: 2

Step: 3

Ace Your Homework with AI
Get the answers you need in no time with our AI-driven, step-by-step assistance
Get Started


