

Question
1. For a), describe the plot. What is the value of the slope? Considering the scatter in the data points, do you think the slope
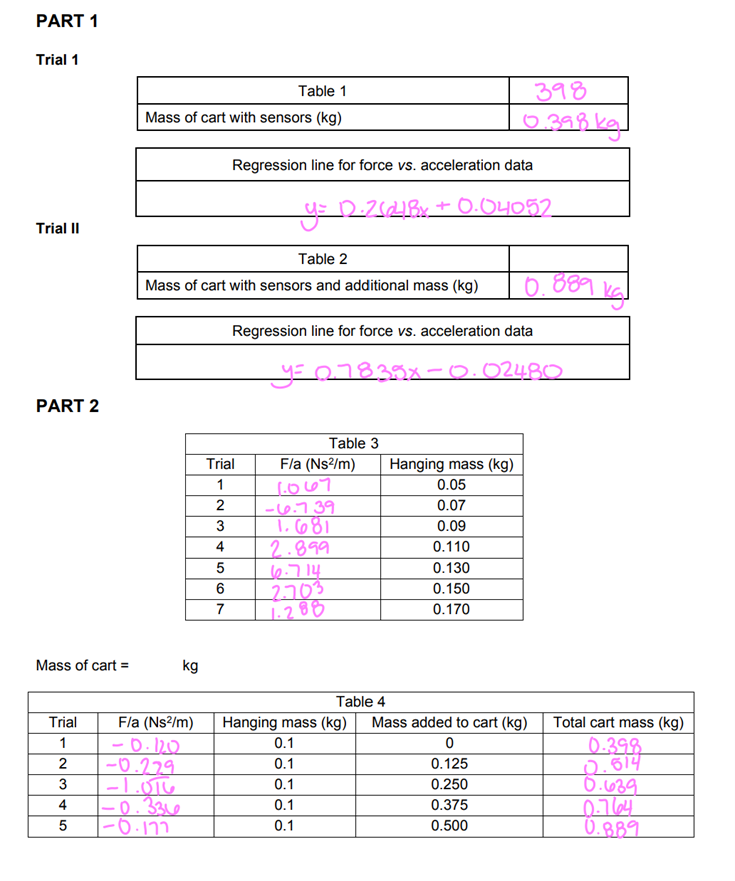
1. For a), describe the plot. What is the value of the slope? Considering the scatter in the data points, do you think the slope is significantly different from zero? If it is zero, explain why? Is there any significant feature of the plot that relates to the value of some physical quantity in the experimental setup?
2. For b), describe the plot. What are the important features? What is the value (plus units) of the slope? Explain why the slope has this value.

Step by Step Solution
There are 3 Steps involved in it
Step: 1

Get Instant Access to Expert-Tailored Solutions
See step-by-step solutions with expert insights and AI powered tools for academic success
Step: 2

Step: 3
Ace Your Homework with AI
Get the answers you need in no time with our AI-driven, step-by-step assistance
Get Started
Lectures On Quantum Mechanics
Authors: Steven Weinberg
2nd Edition
9781107111660