

Question
1. For a horizontal analysis, what is the percent change in revenues for year 3? Convert your final answer to a percentage, round to one
1. For a horizontal analysis, what is the percent change in revenues for year 3? Convert your final answer to a percentage, round to one decimal place and enter without the "%" sign (e.g. a final answer of 0.105678 would be entered as 10.6).
2. What is the company's current ratio for Year 2? Round your final answer to two decimal places.
3. Over the three year period, the company's current ratio is
a. getting better
b. getting worse
4. What is the company's days sales in inventory ratio for Year 2? Round your final answer to one decimal place.
5. What is the company's gross profit ratio for Year 3? Convert your final answer to a percentage, round to one decimal place and enter without the "%" sign (e.g. a final answer of 0.105678 would be entered as 10.6).
6. What is the company's return on investment ratio for Year 1? Convert your final answer to a percentage, round to one decimal place and enter without the "%" sign (e.g. a final answer of 0.105678 would be entered as 10.6).
7. Based on the three years of data, the company's return on investment ratio has
a. improved
b. worsened
c. stayed the same
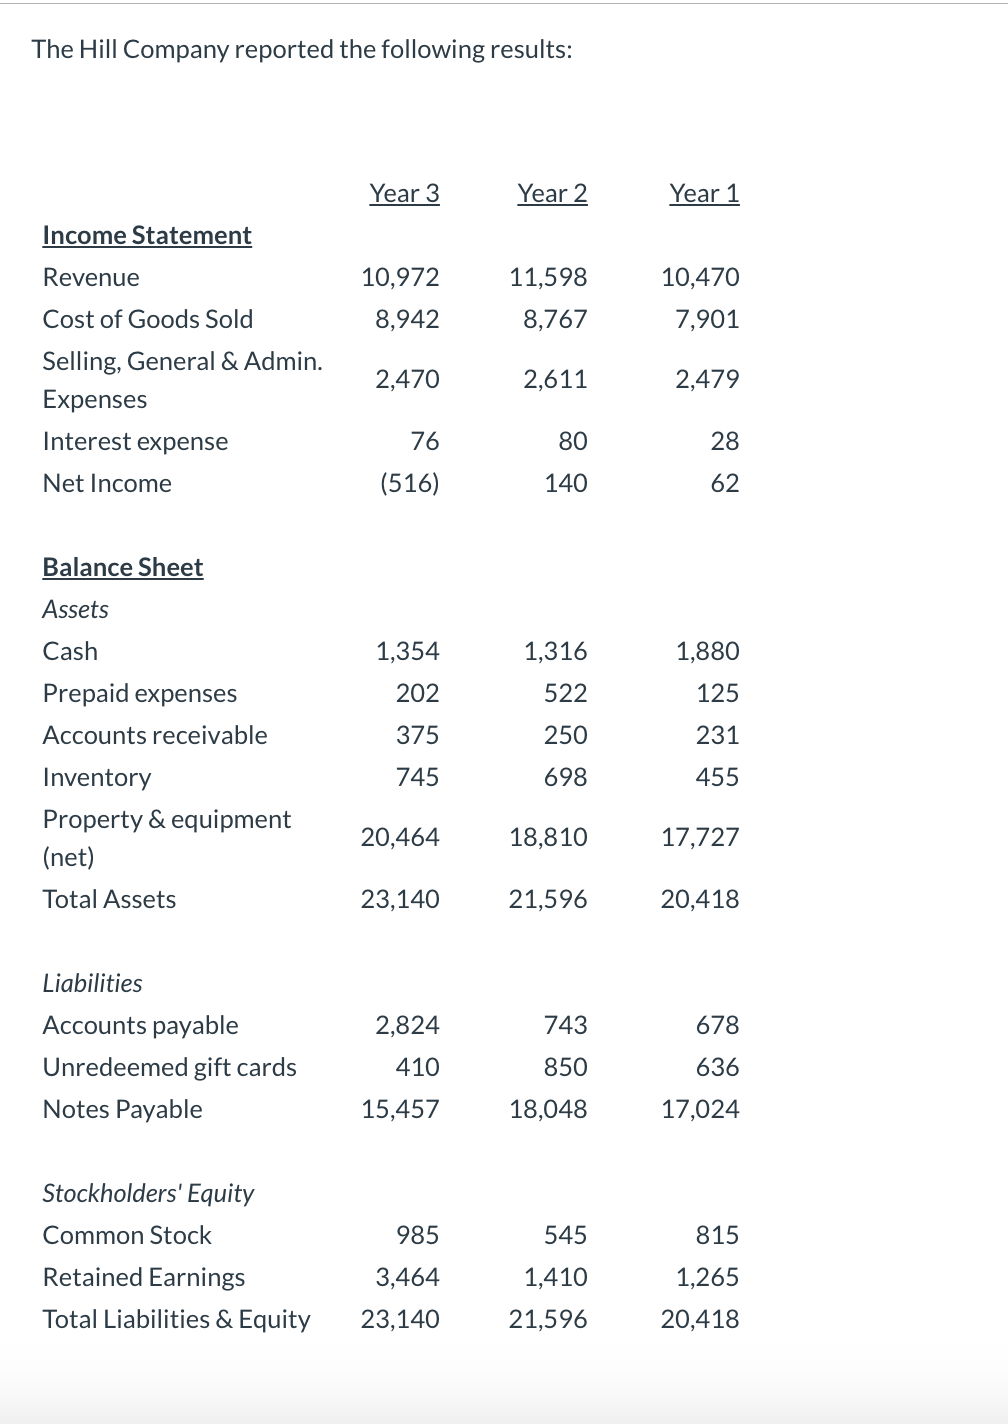
The Hill Company reported the following results: Year 3 Year 2 Year 1 Income Statement 10,972 11,598 8,767 10,470 7,901 8,942 Revenue Cost of Goods Sold Selling, General & Admin. Expenses Interest expense Net Income 2,470 2,611 2,479 76 80 (516) 140 - 62 1,354 1,880 1,316 522 125 Balance Sheet Assets Cash Prepaid expenses Accounts receivable Inventory Property & equipment (net) Total Assets 202 375 250 231 455 745 698 20,464 18,810 17,727 23,140 21,596 20,418 678 Liabilities Accounts payable Unredeemed gift cards Notes Payable 2,824 410 743 850 18,048 636 15,457 17,024 545 815 Stockholders' Equity Common Stock Retained Earnings Total Liabilities & Equity 985 3.464 23,140 1,265 1,410 21,596 20,418 The Hill Company reported the following results: Year 3 Year 2 Year 1 Income Statement 10,972 11,598 8,767 10,470 7,901 8,942 Revenue Cost of Goods Sold Selling, General & Admin. Expenses Interest expense Net Income 2,470 2,611 2,479 76 80 (516) 140 - 62 1,354 1,880 1,316 522 125 Balance Sheet Assets Cash Prepaid expenses Accounts receivable Inventory Property & equipment (net) Total Assets 202 375 250 231 455 745 698 20,464 18,810 17,727 23,140 21,596 20,418 678 Liabilities Accounts payable Unredeemed gift cards Notes Payable 2,824 410 743 850 18,048 636 15,457 17,024 545 815 Stockholders' Equity Common Stock Retained Earnings Total Liabilities & Equity 985 3.464 23,140 1,265 1,410 21,596 20,418Step by Step Solution
There are 3 Steps involved in it
Step: 1

Get Instant Access to Expert-Tailored Solutions
See step-by-step solutions with expert insights and AI powered tools for academic success
Step: 2

Step: 3
Ace Your Homework with AI
Get the answers you need in no time with our AI-driven, step-by-step assistance
Get Started
Excise Tax Air Transportation IRS Audit Techniques Guide ATG
Authors: Internal Revenue Service
1st Edition
1304112772, 978-1304112774