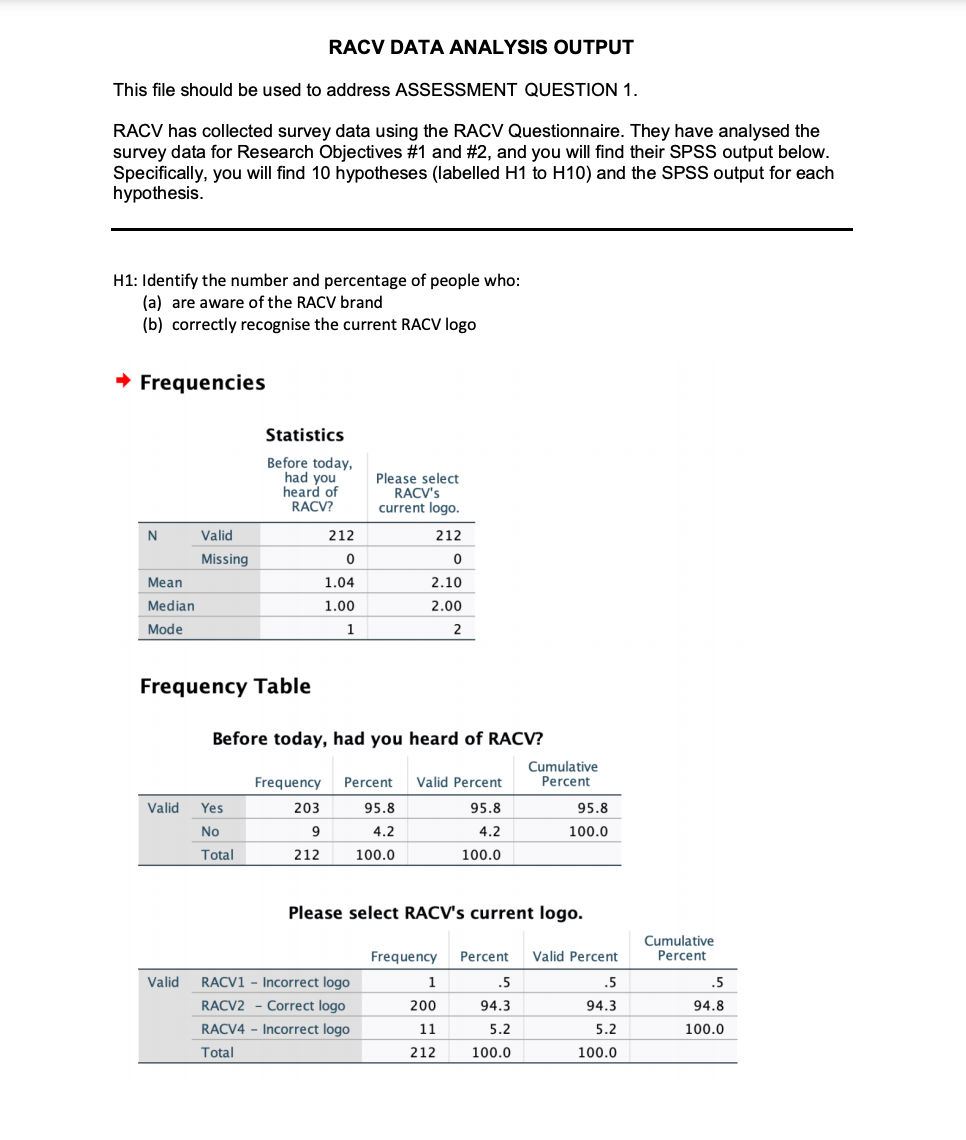
1) For each figure, name the specific statistical test that has been conducted and provide your written interpretation of the SPSS output provided. This should be written in text and contain your interpretation of all relevant parts ofumbers from the SPSS output provided and what they mean in relation to the hypotheses tested.
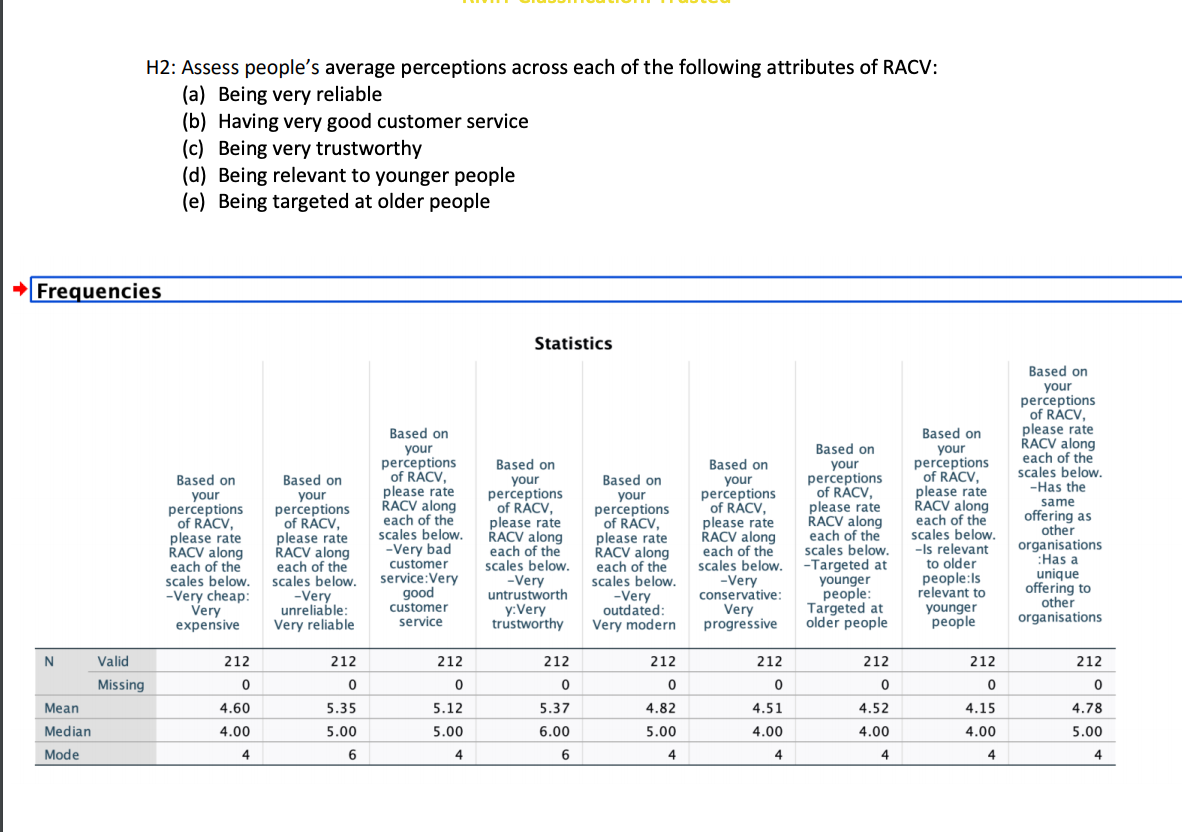
H2: Assess people's average perceptions across each of the following attributes of RACV: (a) Being very reliable (b) Having very good customer service (c) Being very trustworthy (d) Being relevant to younger people (e) Being targeted at older people * Frequencies Statistics Based on your perceptions of RACV, Based on Based on please rate your Based on your RACV along perceptions Based on each of the Based on your perceptions scales below. Based on Based on of RACV, your Based on your perceptions of RACV, please rate please rate -Has the your your perceptions your perceptions of RACV, please rate RACV along same perceptions perceptions RACV along of RACV, perceptions of RACV, of RACV, of RACV, each of the please rate of RACV, please rate RACV along each of the offering as please rate scales below. RACV along please rate RACV along each of the scales below. other please rate RACV along each of the scales below. -Is relevant organisations RACV along -Very bad RACV along each of the each of the customer scales below. each of the scales below. -Targeted at to older :Has a each of the scales below. scales below. service: Very -Very scales below. -Very younger people:Is unique good untrustworth -Very conservative: people: relevant to offering to -Very cheap: -Very Very unreliable: y:Very Targeted at younger other customer outdated: Very organisations expensive Very reliable service trustworthy Very modern progressive older people people N Valid 212 212 212 212 212 212 212 212 212 Missing 0 4.60 5.35 5.12 5.37 4.82 4.51 4.52 4.15 4.78 Mean Median 4.00 5.00 5.00 6.00 5.00 4.00 4.00 4.00 5.00 4 Mode 6 6RACV DATA ANALYSIS OUTPUT This file should be used to address ASSESSMENT QUESTION 1. RACV has collected survey data using the RACV Questionnaire. They have analysed the survey data for Research Objectives #1 and #2, and you will find their SPSS output below. Specifically, you will find 10 hypotheses (labelled H1 to H10) and the SPSS output for each hypothesis. H1: Identify the number and percentage of people who: (a) are aware of the RACV brand (b) correctly recognise the current RACV logo + Frequencies Statistics Before today, had you Please select heard of RACV's RACV? current logo. N alid 212 212 Missing Mean 1.04 2.10 Median 1.00 2.00 Mode Frequency Table Before today, had you heard of RACV? Cumulative Frequency Percent Valid Percent Percent Valid Yes 203 95.8 95.8 95.8 No 4.2 4.2 100.0 Total 212 100.0 100.0 Please select RACV's current logo. Cumulative Frequency Percent Valid Percent Percent Valid RACV1 - Incorrect logo .5 .5 .5 RACV2 - Correct logo 200 94.3 94.3 94.8 RACV4 - Incorrect logo 11 5.2 5.2 100.0 Total 212 100.0 100.0