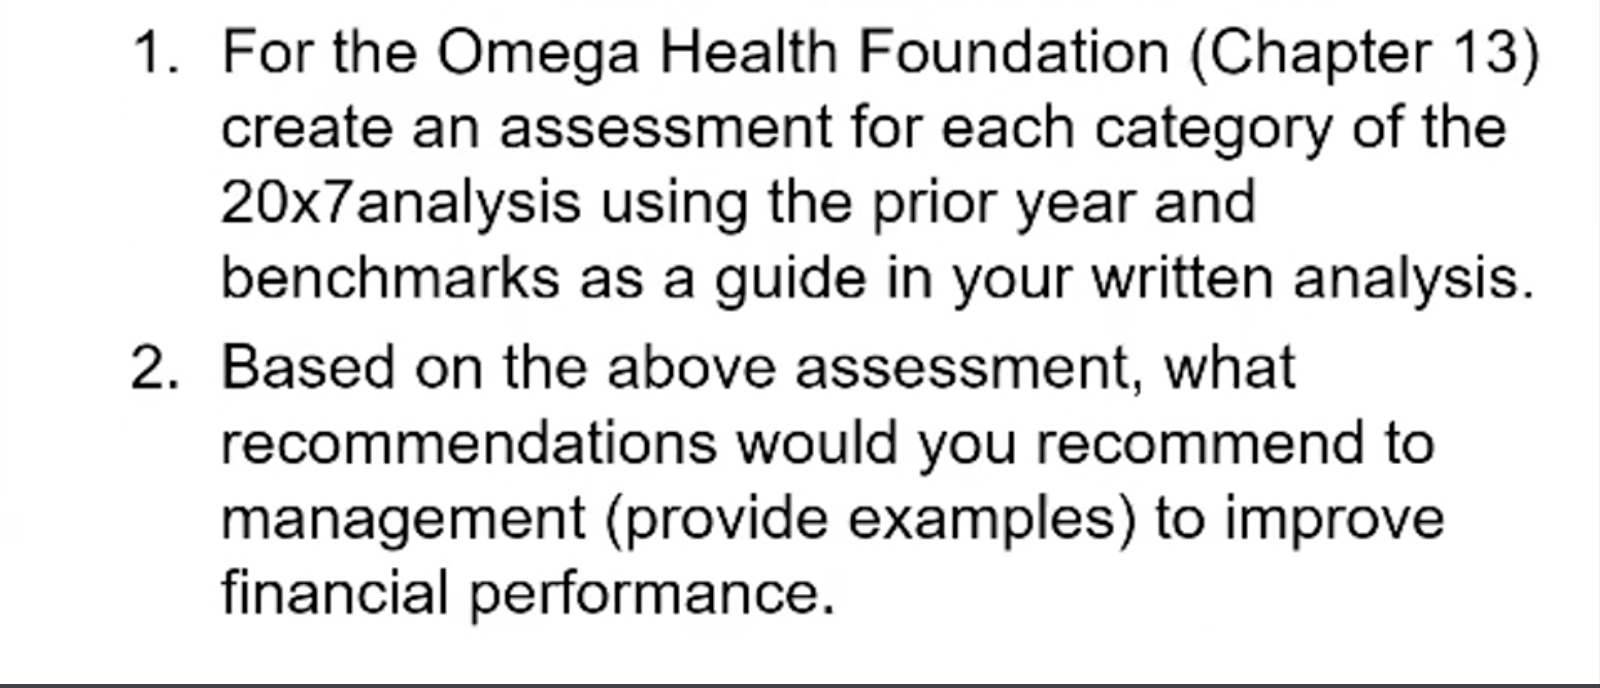
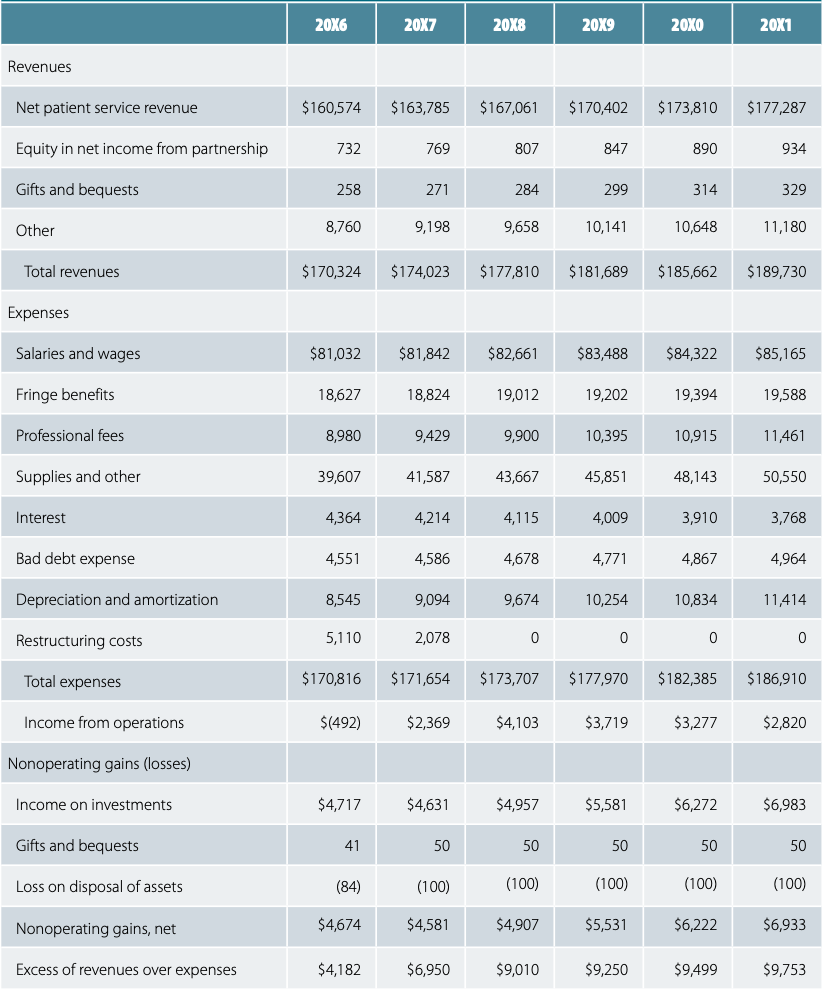
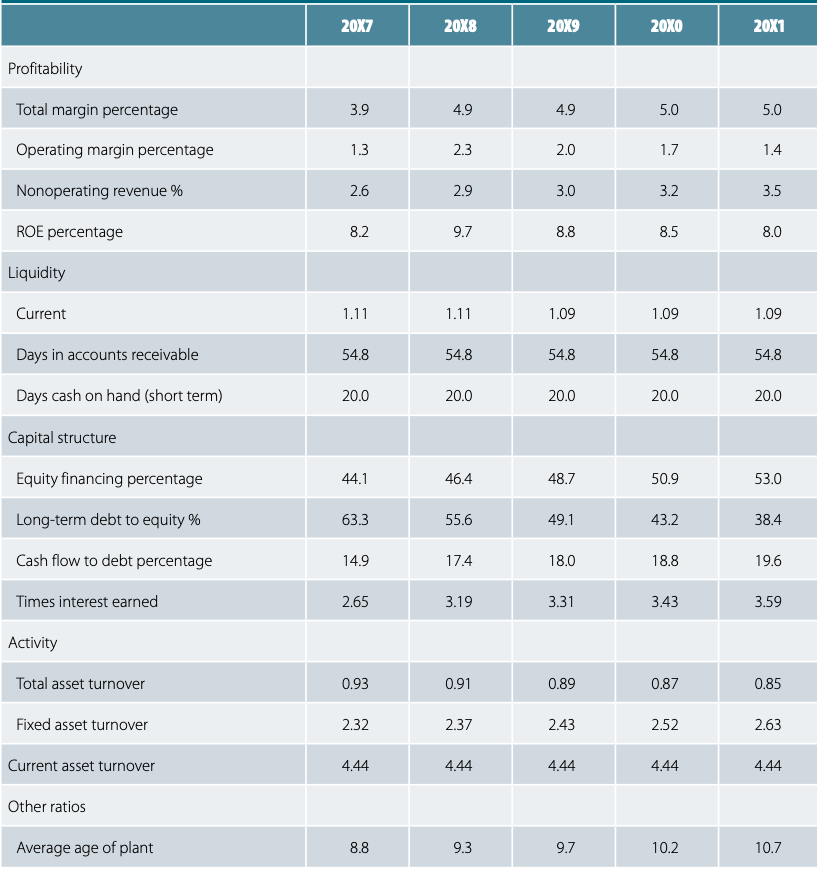
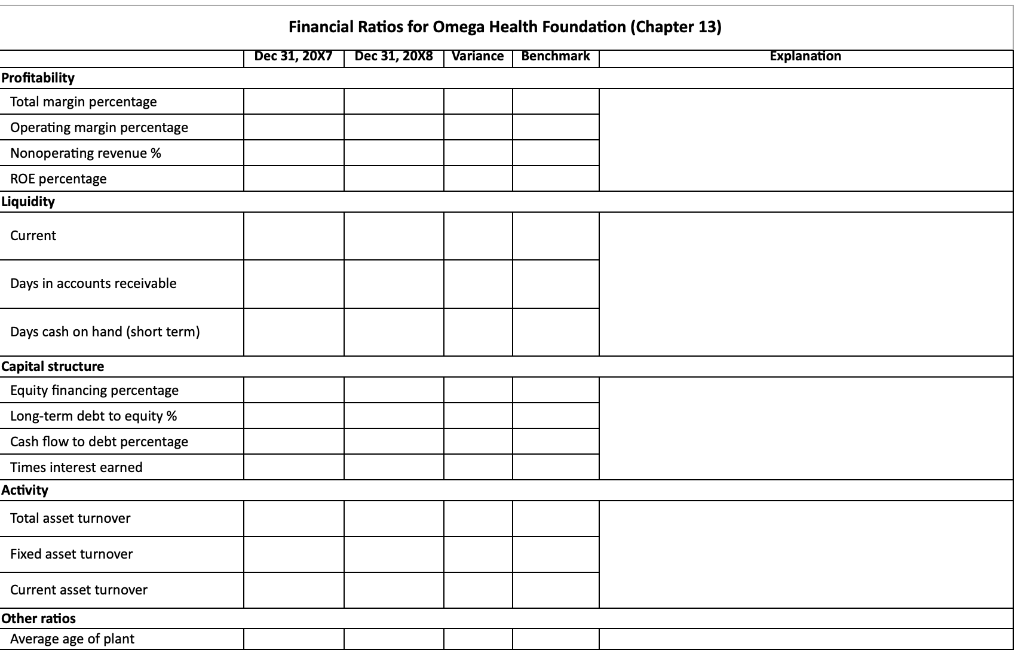
1. For the Omega Health Foundation (Chapter 13) create an assessment for each category of the 20x7analysis using the prior year and benchmarks as a guide in your written analysis. 2. Based on the above assessment, what recommendations would you recommend to management (provide examples) to improve financial performance. 20X6 20X7 20X8 20X9 20X0 20X1 Revenues Net patient service revenue $160,574 $ 163,785 $167,061 $170,402 $173,810 $177,287 Equity in net income from partnership 732 769 807 847 890 934 Gifts and bequests 258 271 284 299 314 329 Other 8,760 9,198 9,658 10,141 10,648 11,180 Total revenues $170,324 $174,023 $177,810 $181,689 $185,662 $189,730 Expenses Salaries and wages $81,032 $81,842 $82,661 $83,488 $84,322 $85,165 Fringe benefits 18,627 18,824 19,012 19,202 19,394 19,588 Professional fees 8,980 9,429 9,900 10,395 10,915 11,461 Supplies and other 39,607 41,587 43,667 45,851 48,143 50,550 Interest 4,364 4,214 4,115 4,009 3,910 3,768 Bad debt expense 4,551 4,586 4,678 4,771 4,867 4,964 Depreciation and amortization 8,545 9,094 9,674 10,254 10,834 11,414 Restructuring costs 5,110 2,078 0 0 o 0 Total expenses $170,816 $171,654 $173,707 $177,970 $182,385 $186,910 Income from operations $(492) $2,369 $4,103 $3,719 $3,277 $2,820 Nonoperating gains (losses) Income on investments $4,717 $4,631 $4,957 $5,581 $6,272 $6,983 Gifts and bequests 41 50 50 50 50 50 Loss on disposal of assets (84) (100) (100) (100) (100) (100) Nonoperating gains, net $4,674 $4,581 $4,907 $5,531 $6,222 $6,933 Excess of revenues over expenses $4,182 $6,950 $9,010 $9,250 $9,499 $9,753 20X7 20X8 20X9 20X0 20X1 Profitability Total margin percentage 3.9 4.9 4.9 5.0 5.0 Operating margin percentage 1.3 2.3 2.0 1.7 1.4 Nonoperating revenue % 2.6 2.9 3.0 3.2 3.5 ROE percentage 8.2 9.7 8.8 8.5 8.0 Liquidity Current 1.11 1.11 1.09 1.09 1.09 Days in accounts receivable 54.8 54.8 54.8 54.8 54.8 Days cash on hand (short term) 20.0 20.0 20.0 20.0 20.0 Capital structure Equity financing percentage 44.1 46.4 48.7 50.9 53.0 Long-term debt to equity % 63.3 55.6 49.1 43.2 38.4 Cash flow to debt percentage 14.9 17.4 18.0 18.8 19.6 Times interest earned 2.65 3.19 3.31 3.43 3.59 Activity Total asset turnover 0.93 0.91 0.89 0.87 0.85 Fixed asset turnover 2.32 2.37 2.43 2.52 2.63 Current asset turnover 4.44 4.44 4.44 4.44 4.44 Other ratios Average age of plant 8.8 9.3 9.7 10.2 10.7 Financial Ratios for Omega Health Foundation (Chapter 13) Dec 31, 20X7 Dec 31, 20X8 Variance Benchmark Explanation Profitability Total margin percentage Operating margin percentage Nonoperating revenue % ROE percentage Liquidity Current Days in accounts receivable Days cash on hand (short term) Capital structure Equity financing percentage Long-term debt to equity % Cash flow to debt percentage Times interest earned Activity Total asset turnover Fixed asset turnover Current asset turnover Other ratios Average age of plant 1. For the Omega Health Foundation (Chapter 13) create an assessment for each category of the 20x7analysis using the prior year and benchmarks as a guide in your written analysis. 2. Based on the above assessment, what recommendations would you recommend to management (provide examples) to improve financial performance. 20X6 20X7 20X8 20X9 20X0 20X1 Revenues Net patient service revenue $160,574 $ 163,785 $167,061 $170,402 $173,810 $177,287 Equity in net income from partnership 732 769 807 847 890 934 Gifts and bequests 258 271 284 299 314 329 Other 8,760 9,198 9,658 10,141 10,648 11,180 Total revenues $170,324 $174,023 $177,810 $181,689 $185,662 $189,730 Expenses Salaries and wages $81,032 $81,842 $82,661 $83,488 $84,322 $85,165 Fringe benefits 18,627 18,824 19,012 19,202 19,394 19,588 Professional fees 8,980 9,429 9,900 10,395 10,915 11,461 Supplies and other 39,607 41,587 43,667 45,851 48,143 50,550 Interest 4,364 4,214 4,115 4,009 3,910 3,768 Bad debt expense 4,551 4,586 4,678 4,771 4,867 4,964 Depreciation and amortization 8,545 9,094 9,674 10,254 10,834 11,414 Restructuring costs 5,110 2,078 0 0 o 0 Total expenses $170,816 $171,654 $173,707 $177,970 $182,385 $186,910 Income from operations $(492) $2,369 $4,103 $3,719 $3,277 $2,820 Nonoperating gains (losses) Income on investments $4,717 $4,631 $4,957 $5,581 $6,272 $6,983 Gifts and bequests 41 50 50 50 50 50 Loss on disposal of assets (84) (100) (100) (100) (100) (100) Nonoperating gains, net $4,674 $4,581 $4,907 $5,531 $6,222 $6,933 Excess of revenues over expenses $4,182 $6,950 $9,010 $9,250 $9,499 $9,753 20X7 20X8 20X9 20X0 20X1 Profitability Total margin percentage 3.9 4.9 4.9 5.0 5.0 Operating margin percentage 1.3 2.3 2.0 1.7 1.4 Nonoperating revenue % 2.6 2.9 3.0 3.2 3.5 ROE percentage 8.2 9.7 8.8 8.5 8.0 Liquidity Current 1.11 1.11 1.09 1.09 1.09 Days in accounts receivable 54.8 54.8 54.8 54.8 54.8 Days cash on hand (short term) 20.0 20.0 20.0 20.0 20.0 Capital structure Equity financing percentage 44.1 46.4 48.7 50.9 53.0 Long-term debt to equity % 63.3 55.6 49.1 43.2 38.4 Cash flow to debt percentage 14.9 17.4 18.0 18.8 19.6 Times interest earned 2.65 3.19 3.31 3.43 3.59 Activity Total asset turnover 0.93 0.91 0.89 0.87 0.85 Fixed asset turnover 2.32 2.37 2.43 2.52 2.63 Current asset turnover 4.44 4.44 4.44 4.44 4.44 Other ratios Average age of plant 8.8 9.3 9.7 10.2 10.7 Financial Ratios for Omega Health Foundation (Chapter 13) Dec 31, 20X7 Dec 31, 20X8 Variance Benchmark Explanation Profitability Total margin percentage Operating margin percentage Nonoperating revenue % ROE percentage Liquidity Current Days in accounts receivable Days cash on hand (short term) Capital structure Equity financing percentage Long-term debt to equity % Cash flow to debt percentage Times interest earned Activity Total asset turnover Fixed asset turnover Current asset turnover Other ratios Average age of plant


