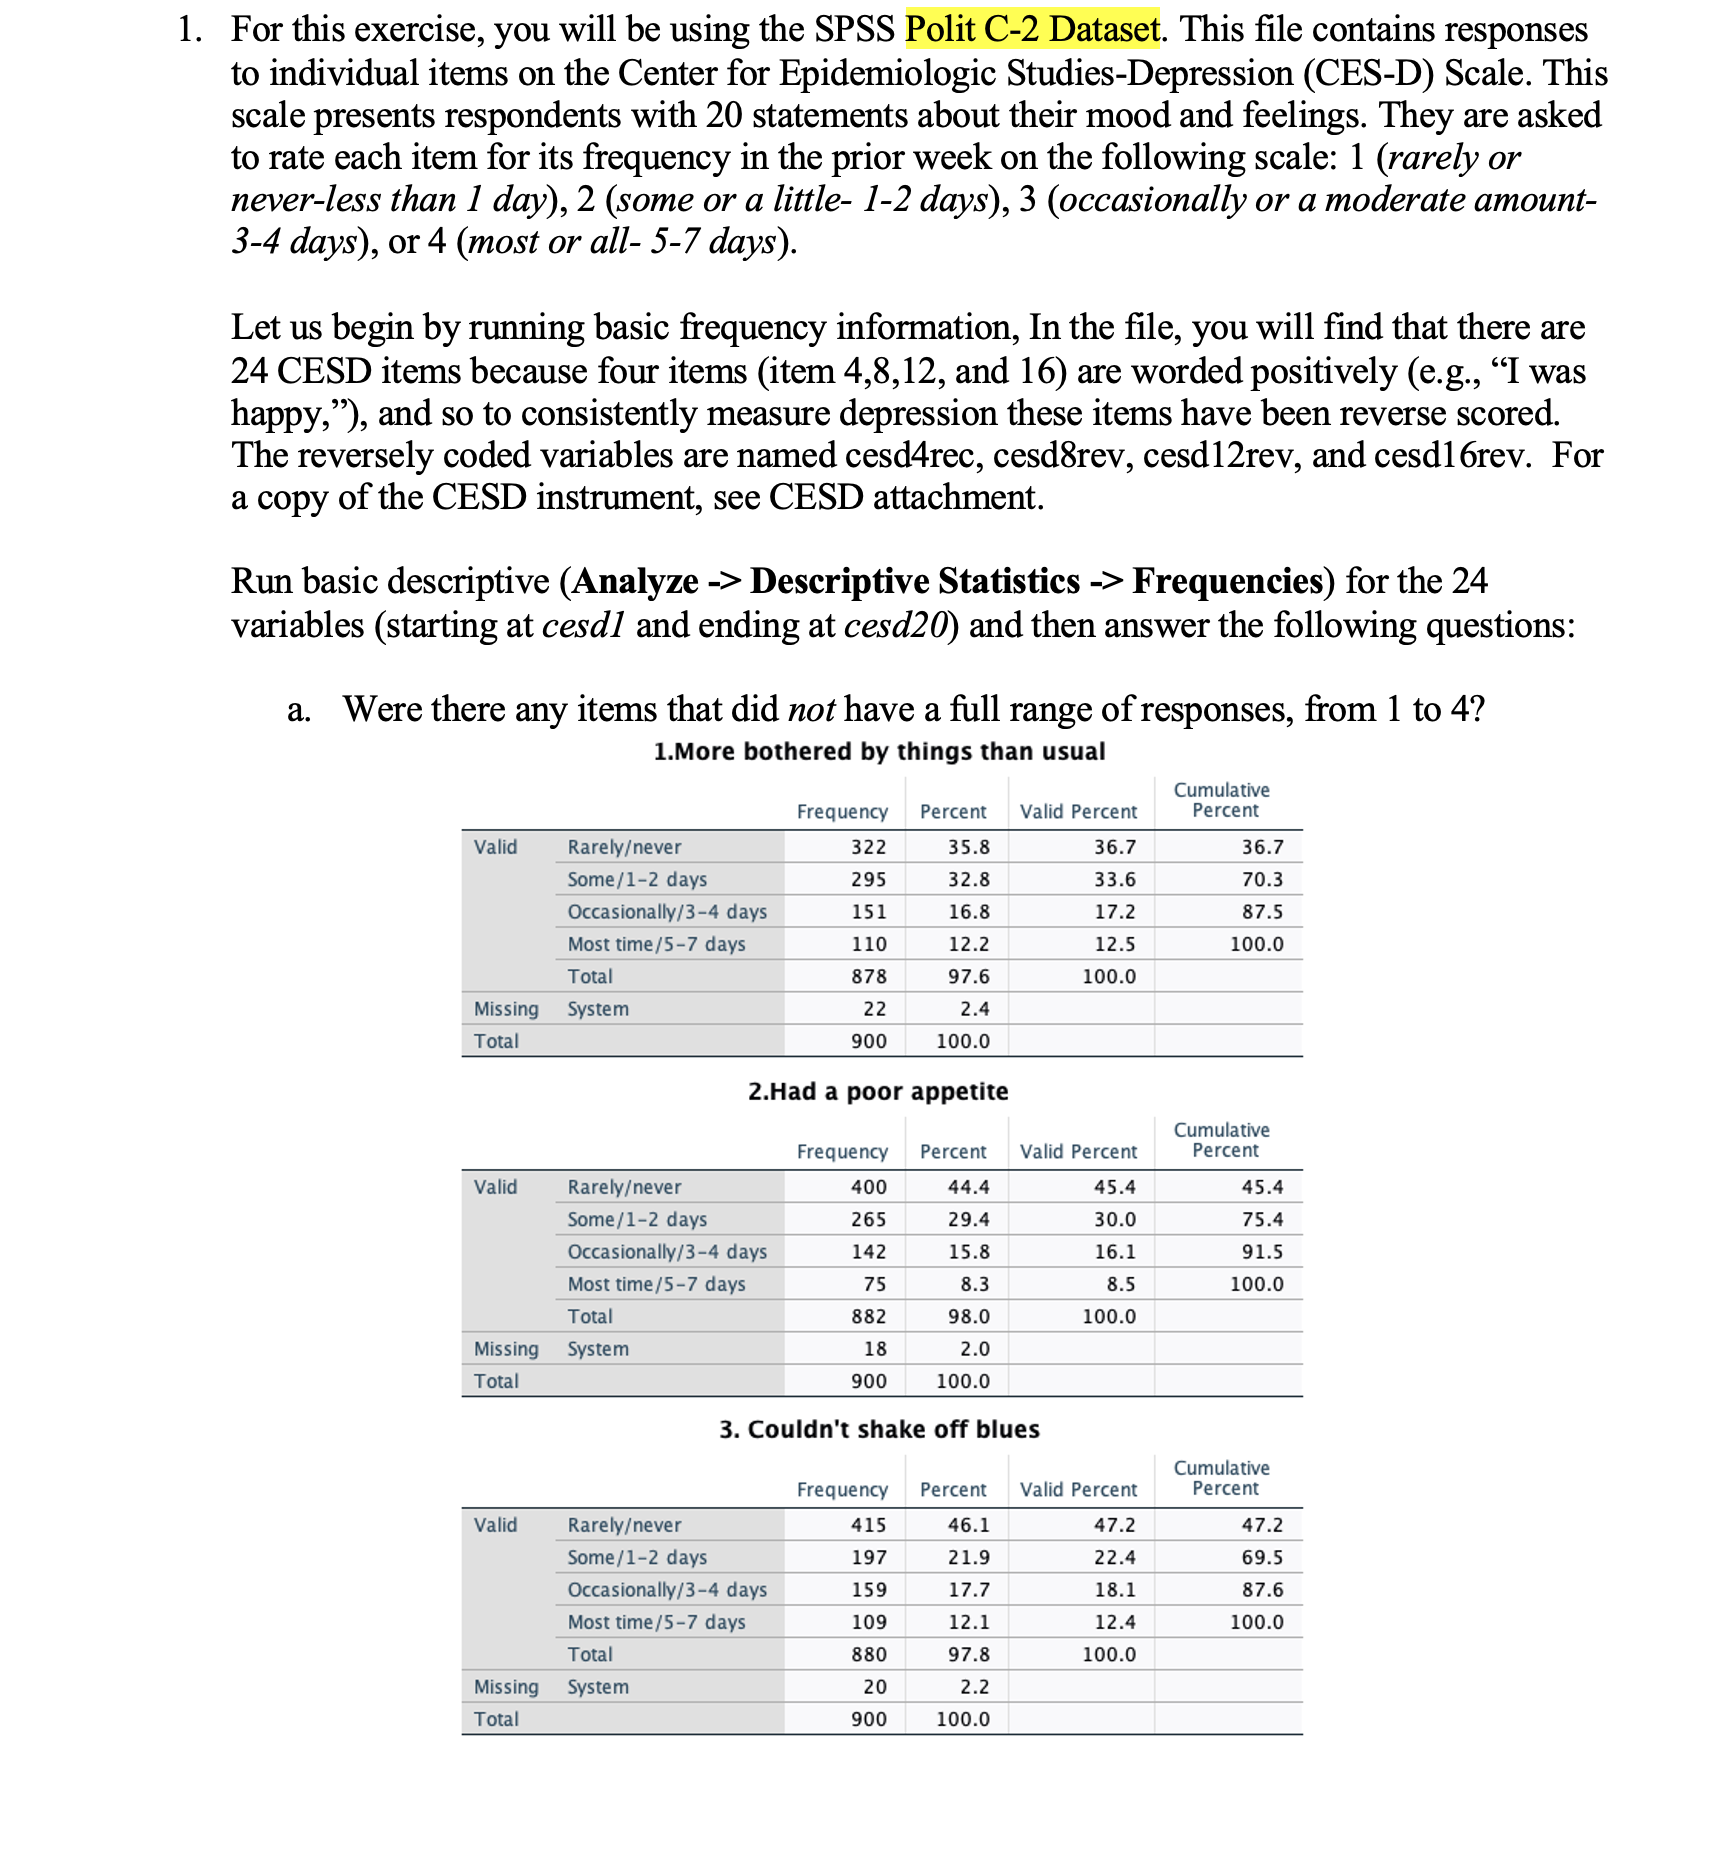
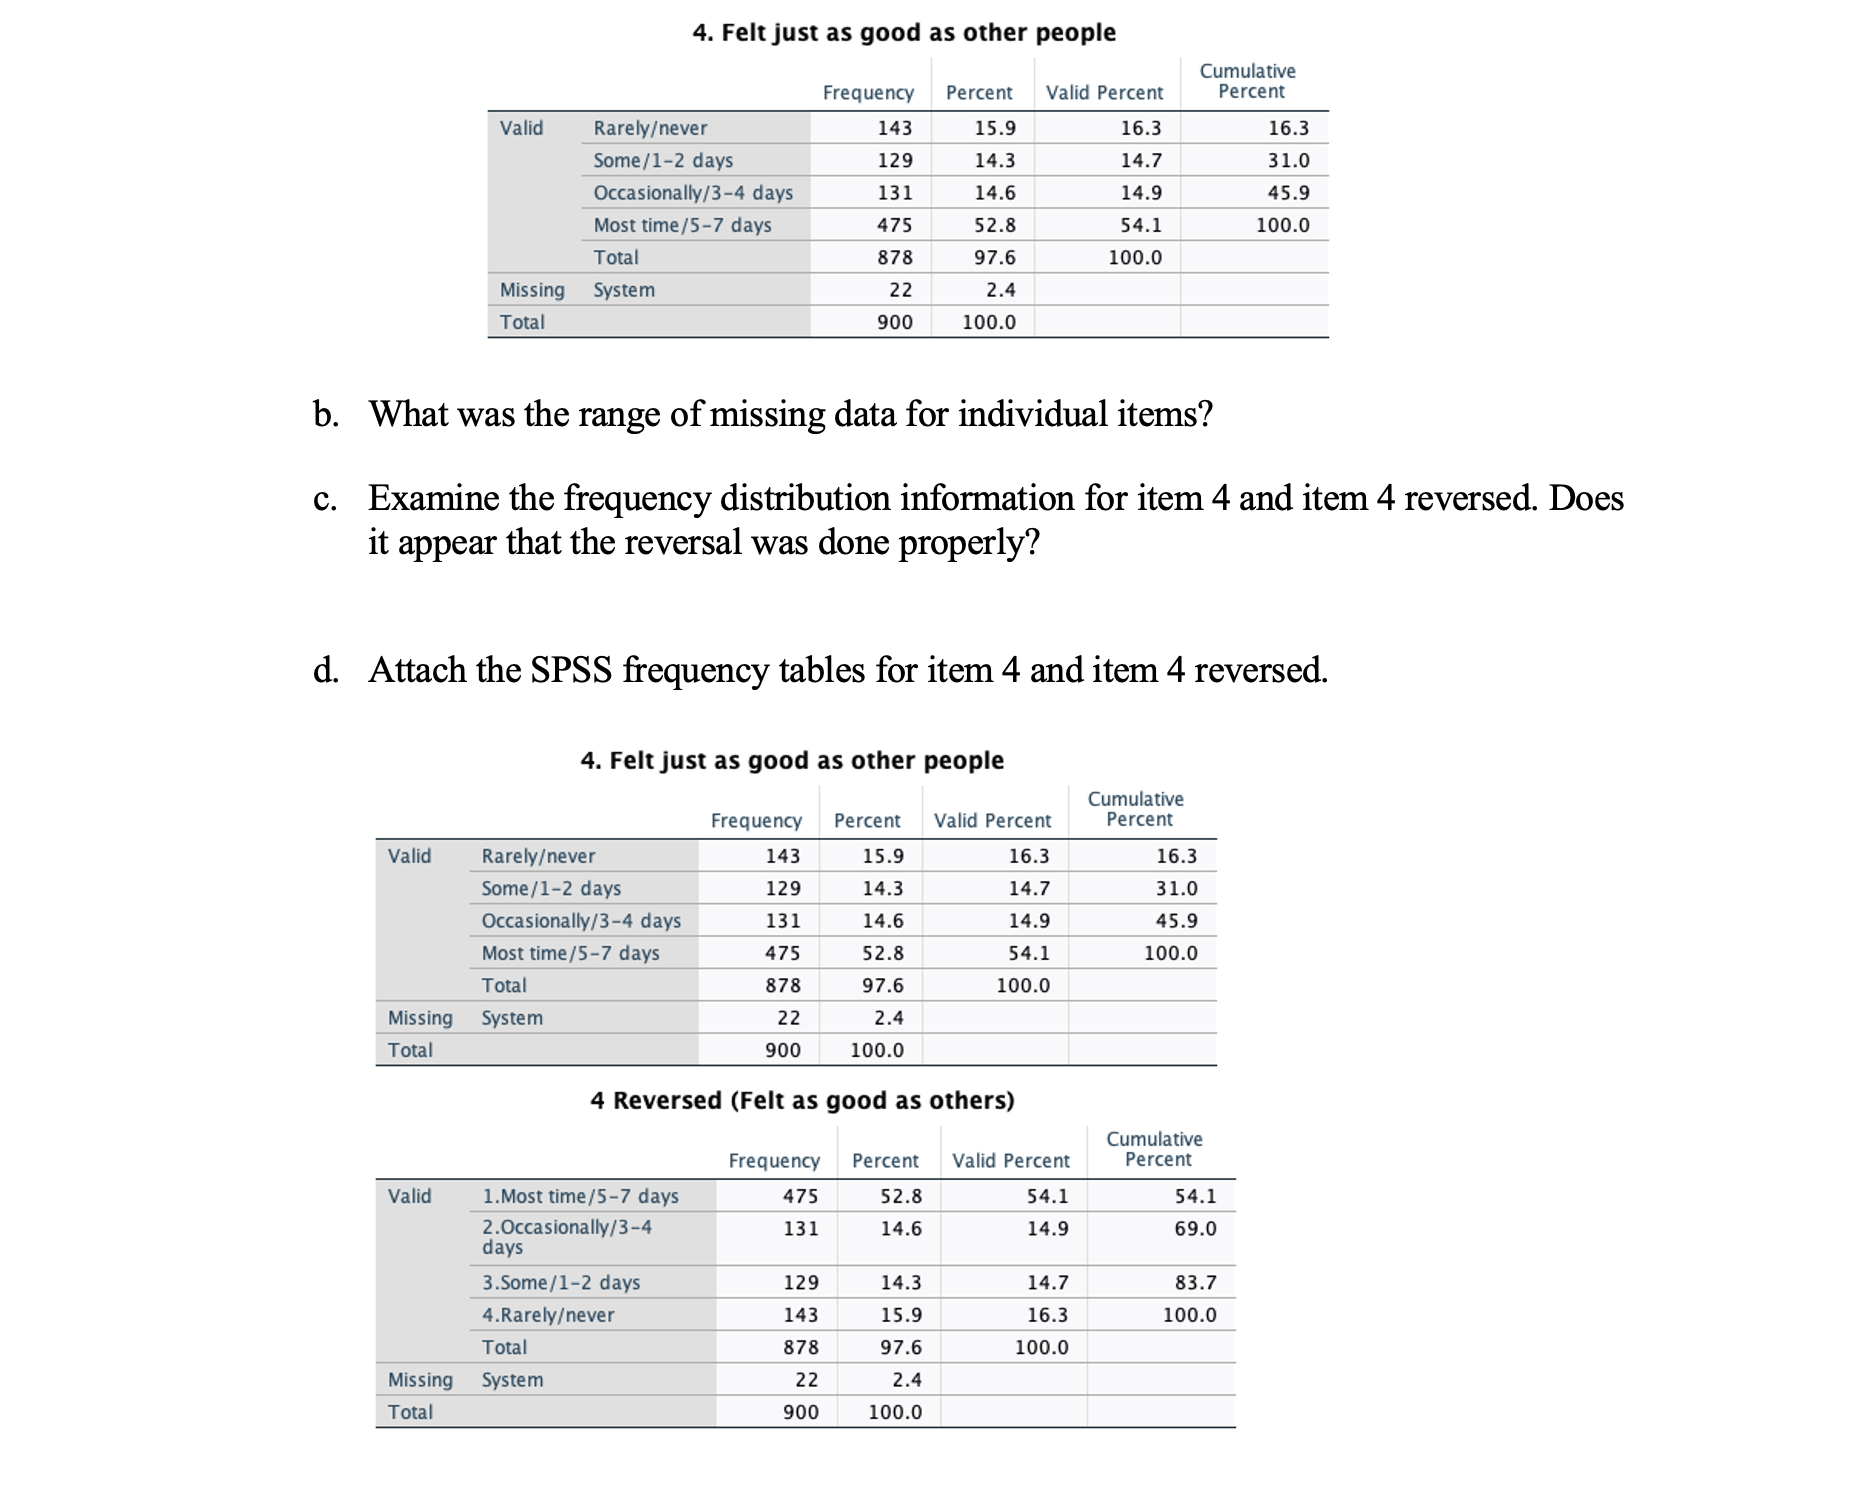
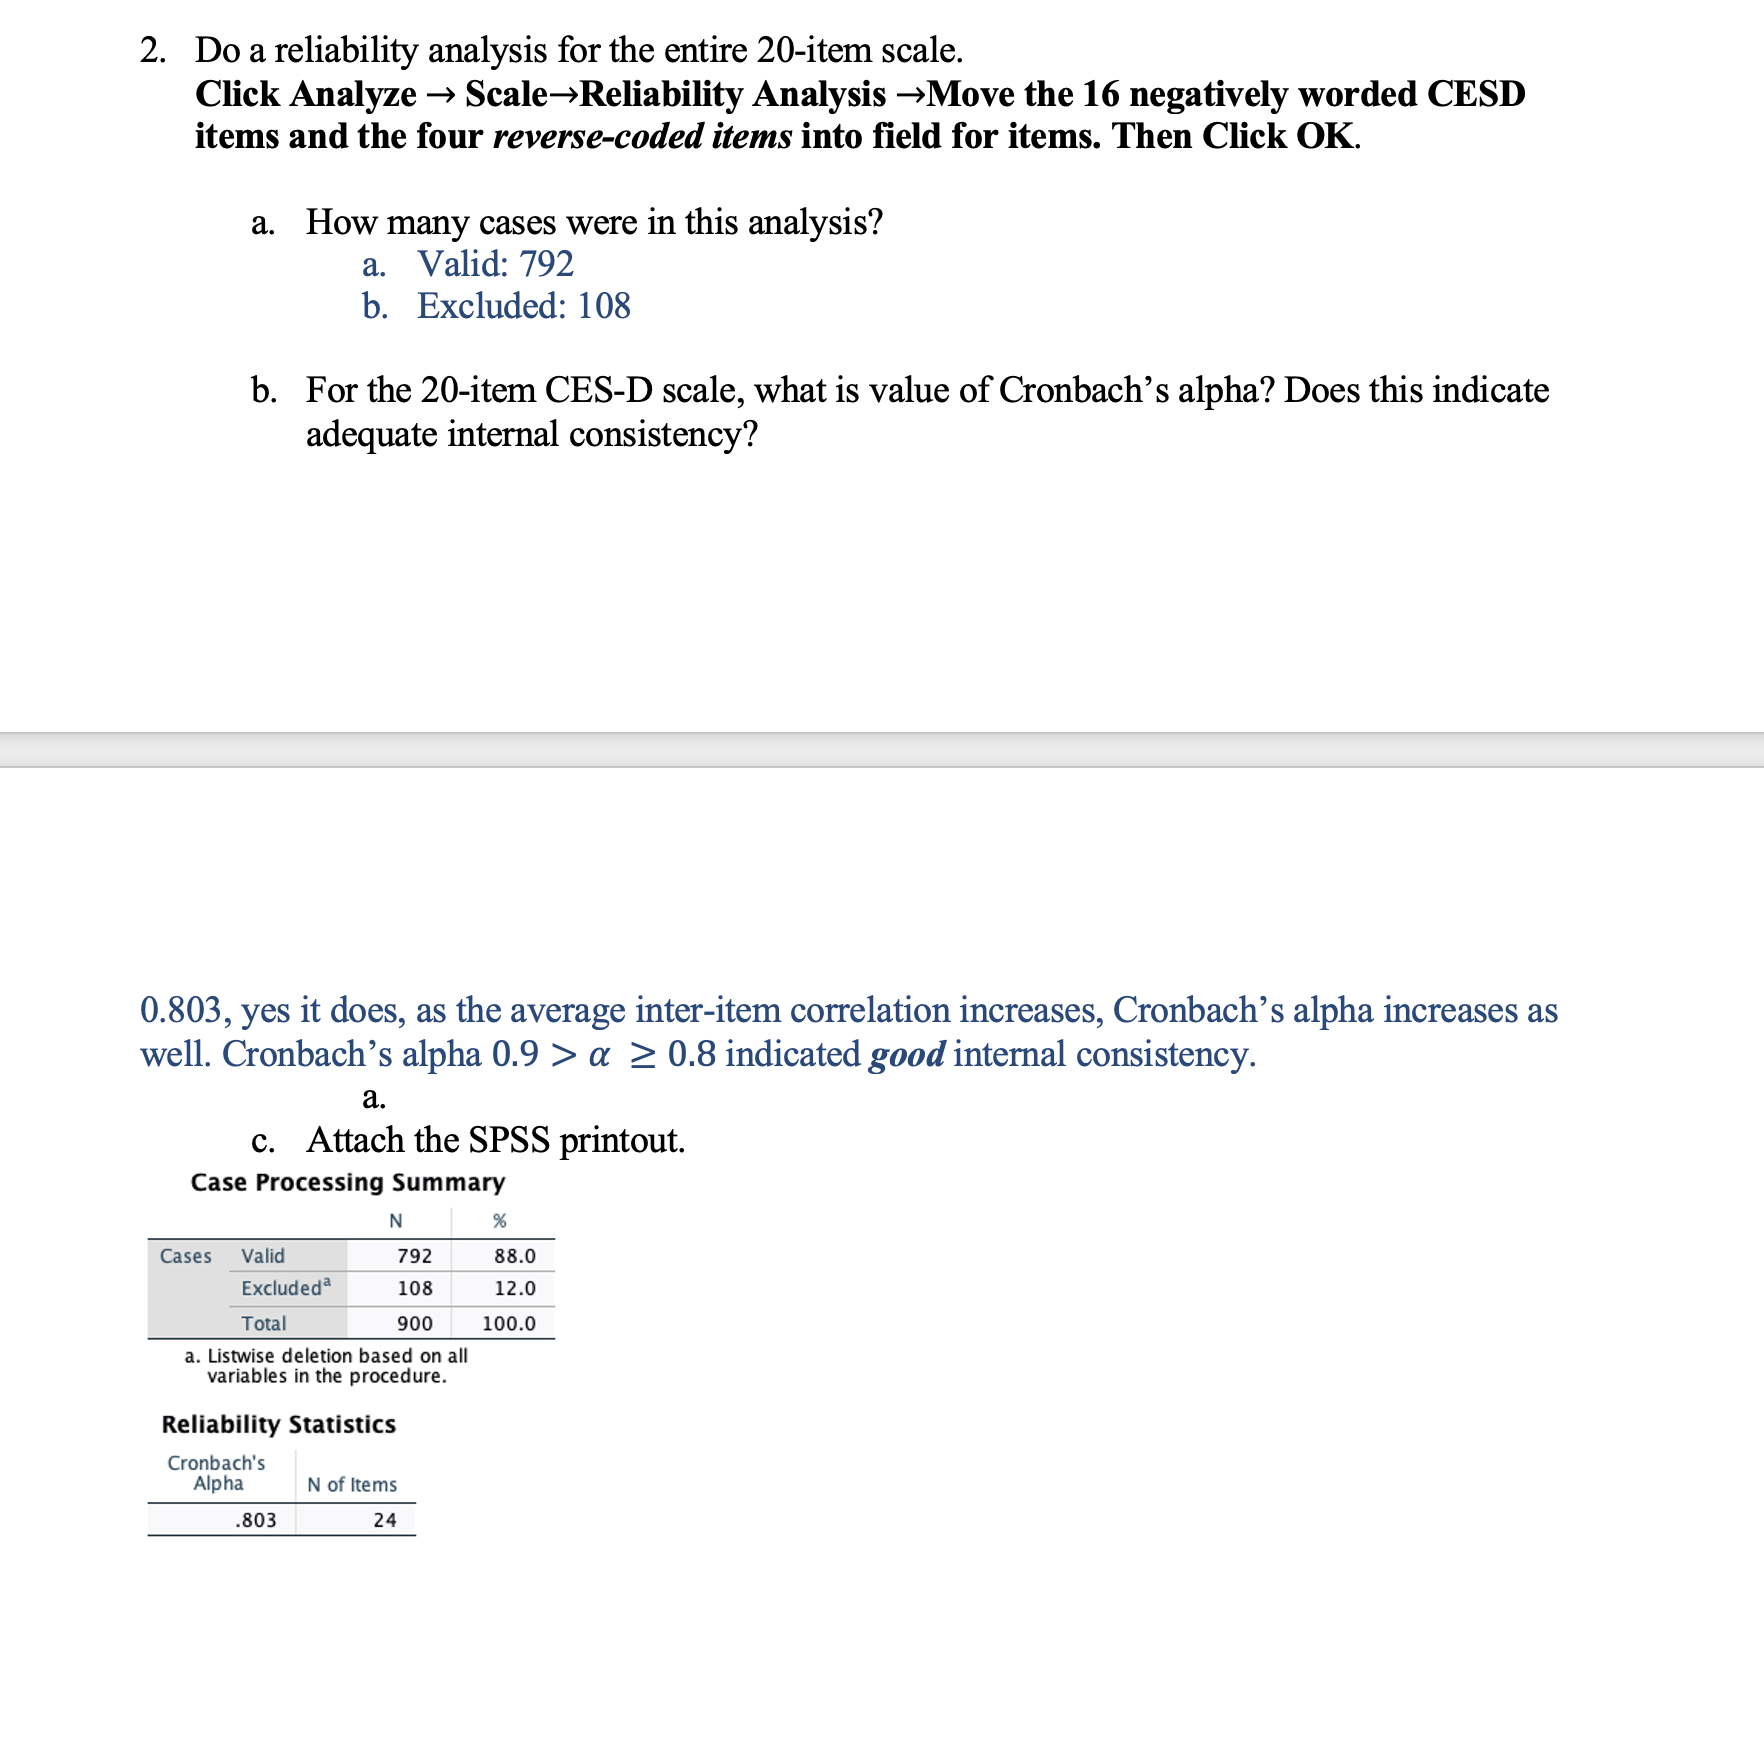
1. For this exercise, you will be using the SPSS Polit C-2 Dataset. This file contains responses to individual items on the Center for Epidemiologic Studies-Depression (CES-D) Scale. This scale presents respondents with 20 statements about their mood and feelings. They are asked to rate each item for its frequency in the prior week on the following scale: 1 (rarely or never-less than 1 day), 2 (some or a little- 1-2 days), 3 (occasionally or a moderate amount- 3-4 days), or 4 (most or all- 5-7 days). Let us begin by running basic frequency information, In the file, you will find that there are 24 CESD items because four items (item 4,8, 12, and 16) are worded positively (e.g., "I was happy,"), and so to consistently measure depression these items have been reverse scored The reversely coded variables are named cesd4rec, cesd8rev, cesd12rev, and cesdl 6rev. For a copy of the CESD instrument, see CESD attachment. Run basic descriptive (Analyze -> Descriptive Statistics -> Frequencies) for the 24 variables (starting at cesd) and ending at cesd20) and then answer the following questions: a. Were there any items that did not have a full range of responses, from 1 to 4? 1.More bothered by things than usual Cumulative Frequency Percent Valid Percent Percent Valid Rarelyever 322 35.8 36.7 36.7 Some/1-2 days 295 32.8 33.6 70.3 Occasionally/3-4 days 151 16.8 17.2 87.5 Most time/5-7 days 110 12.2 12.5 100.0 Total 378 97.6 100.0 Missing System 22 2.4 Total 900 100.0 2.Had a poor appetite Cumulative Frequency Percent Valid Percent Percent Valid Rarelyever 40 14.4 45.4 45.4 Some/1-2 days 265 29.4 30.0 75.4 Occasionally/3-4 days 142 15.8 16.1 91.5 Most time/5-7 days 75 8.3 8.5 100.0 Total 382 98.0 100.0 Missing System 18 2. Total 900 100.0 3. Couldn't shake off blues Cumulative Frequency Percent Valid Percent Percent Valid Rarelyever 415 46.1 47.2 47.2 Some/1-2 days 197 21.9 22.4 69.5 Occasionally/3-4 days 159 17.7 18.1 87.6 Most time/5-7 days 109 12.1 12.4 100.0 Total 380 97.8 100. Missing System 20 2.2 Total 900 100.04. Felt just as good as other people Cumulative Frequency Percent Valid Percent Percent Valid Rarelyever 143 15.9 16.3 16.3 Some/1-2 days 129 14.3 14.7 31.0 Occasionally/3-4 days 131 14.6 14.9 45.9 Most time/5-7 days 475 52.8 54.1 100.0 Total 878 97.6 100.0 Missing System 22 2.4 Total 900 100.0 b. What was the range of missing data for individual items? c. Examine the frequency distribution information for item 4 and item 4 reversed. Does it appear that the reversal was done properly? d. Attach the SPSS frequency tables for item 4 and item 4 reversed. 4. Felt just as good as other people Cumulative Frequency Percent Valid Percent Percent Valid Rarelyever 143 15.9 16.3 16.3 Some/1-2 days 129 14.3 14.7 31.0 Occasionally/3-4 days 131 14.6 14.9 45.9 Most time/5-7 days 475 52.8 54.1 100.0 Total 878 97.6 100.0 Missing System 22 2.4 Total 900 100.0 4 Reversed (Felt as good as others) Cumulative Frequency Percent Valid Percent Percent Valid 1. Most time/5-7 days 475 52.8 54. 54.1 2.Occasionally/3-4 131 14.6 14.9 69.0 days 3.Some/1-2 days 129 14.3 14.7 83.7 4.Rarelyever 143 15.9 16.3 100.0 Total 878 97.6 100.0 Missing System 22 2.4 Total 900 100.02. Do a reliability analysis for the entire 20-item scale. Click Analyze - Scale-Reliability Analysis -Move the 16 negatively worded CESD items and the four reverse-coded items into field for items. Then Click OK. a. How many cases were in this analysis? a. Valid: 792 b. Excluded: 108 b. For the 20-item CES-D scale, what is value of Cronbach's alpha? Does this indicate adequate internal consistency? 0.803, yes it does, as the average inter-item correlation increases, Cronbach's alpha increases as well. Cronbach's alpha 0.9 > a 2 0.8 indicated good internal consistency. C. Attach the SPSS printout. Case Processing Summary Cases Valid 792 88.0 Excluded 108 12.0 Total 900 100.0 . Listwise deletion based on all variables in the procedure. Reliability Statistics Cronbach's Alpha N of Items .803 24