Answered step by step
Verified Expert Solution
Question
1 Approved Answer
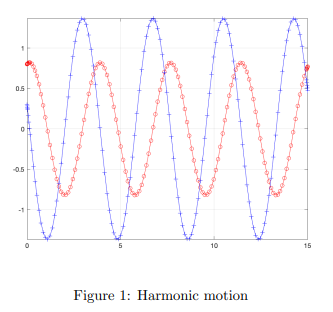
1. From the graph in Fig. 1 answer the following questions. (a) Which curve represents y = y(t)? How do you know? (b) What


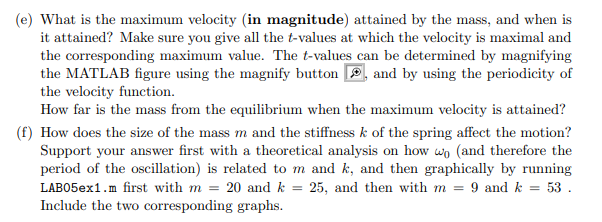
1. From the graph in Fig. 1 answer the following questions. (a) Which curve represents y = y(t)? How do you know? (b) What is the period of the motion? Answer this question first graphically (by reading the period from the graph) and then analytically (by finding the period using wo). (c) We say that the mass comes to rest if, after a certain time, the position of the mass remains within an arbitrary small distance from the equilibrium position. Will the mass ever come to rest? Why? (d) What is the amplitude of the oscillations for y? 0.5 -0.5 10 15 Figure 1: Harmonic motion (e) What is the maximum velocity (in magnitude) attained by the mass, and when is it attained? Make sure you give all the t-values at which the velocity is maximal and the corresponding maximum value. The t-values can be determined by magnifying the MATLAB figure using the magnify button and by using the periodicity of the velocity function. How far is the mass from the equilibrium when the maximum velocity is attained? (f) How does the size of the mass m and the stiffness k of the spring affect the motion? Support your answer first with a theoretical analysis on how wo (and therefore the period of the oscillation) is related to m and k, and then graphically by running LAB05ex1.m first with m = 20 and k = 25, and then with m = 9 and k = 53. Include the two corresponding graphs.
Step by Step Solution
There are 3 Steps involved in it
Step: 1
Certainly Lets delve into each subquestion one by one a Which curve represents y yt How do you know To determine which curve represents yt we need to observe the graph and recognize the characteristics of a typical position vs time plot for harmonic motion On the graph the red curve with circles has a longer period relative to the blue curve with crosses The position function yt for simple harmonic motion typically follows a sine or cosine function Given two curves the one with a longer period and smoother oscillation red curve can be identified as y yt Answer The red curve represents y yt This determination is based on the observation of the graph where the red curve displays a smoother longer period oscillation characteristic ...
Get Instant Access to Expert-Tailored Solutions
See step-by-step solutions with expert insights and AI powered tools for academic success
Step: 2

Step: 3

Ace Your Homework with AI
Get the answers you need in no time with our AI-driven, step-by-step assistance
Get Started


