Answered step by step
Verified Expert Solution
Question
1 Approved Answer
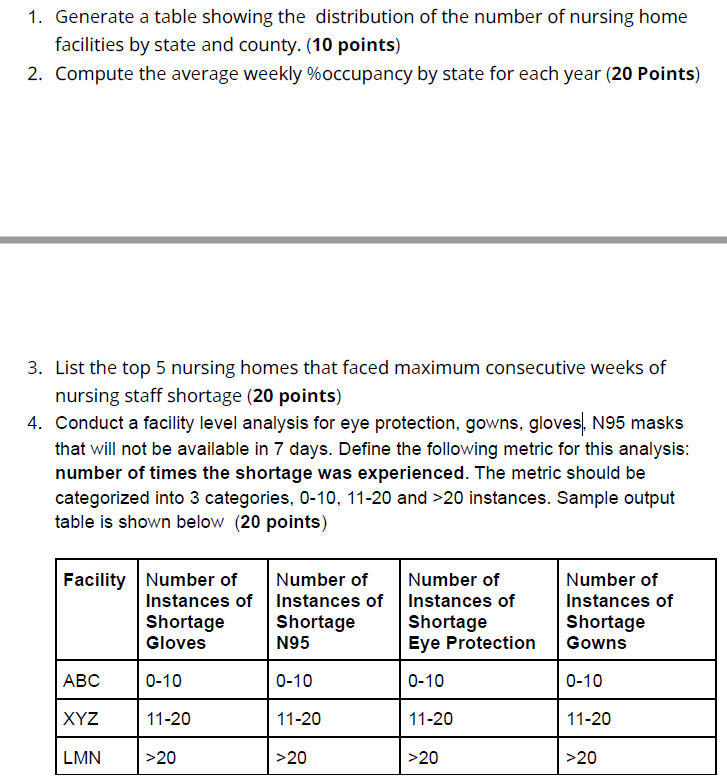
1. Generate a table showing the distribution of the number of nursing home facilities by state and county. (10 points) 2. Compute the average

1. Generate a table showing the distribution of the number of nursing home facilities by state and county. (10 points) 2. Compute the average weekly %occupancy by state for each year (20 Points) 3. List the top 5 nursing homes that faced maximum consecutive weeks of nursing staff shortage (20 points) 4. Conduct a facility level analysis for eye protection, gowns, gloves, N95 masks that will not be available in 7 days. Define the following metric for this analysis: number of times the shortage was experienced. The metric should be categorized into 3 categories, 0-10, 11-20 and >20 instances. Sample output table is shown below (20 points) Facility Number of Instances of ABC XYZ LMN Shortage Gloves 0-10 11-20 >20 Number of Instances of Shortage N95 0-10 11-20 >20 Number of Instances of Shortage Eye Protection 0-10 11-20 >20 Number of Instances of Shortage Gowns 0-10 11-20 >20
Step by Step Solution
There are 3 Steps involved in it
Step: 1

Get Instant Access to Expert-Tailored Solutions
See step-by-step solutions with expert insights and AI powered tools for academic success
Step: 2

Step: 3

Ace Your Homework with AI
Get the answers you need in no time with our AI-driven, step-by-step assistance
Get Started


