

Answered step by step
Verified Expert Solution
Question
1 Approved Answer
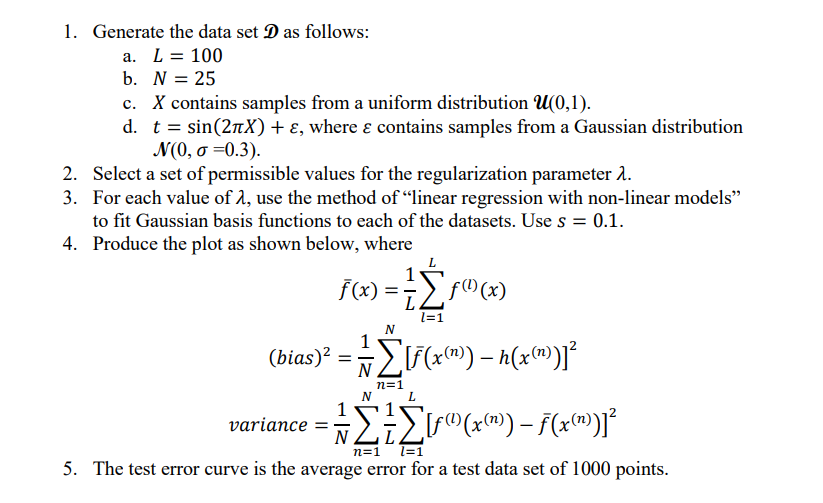
1. Generate the data set D as follows: a. L=100 b. N=25 c. X contains samples from a uniform distribution U(0,1). d. t=sin(2X)+, where contains
Step by Step Solution
There are 3 Steps involved in it
Step: 1

Get Instant Access to Expert-Tailored Solutions
See step-by-step solutions with expert insights and AI powered tools for academic success
Step: 2

Step: 3
Ace Your Homework with AI
Get the answers you need in no time with our AI-driven, step-by-step assistance
Get Started
Making Databases Work The Pragmatic Wisdom Of Michael Stonebraker
Authors: Michael L. Brodie
1st Edition
1947487167, 978-1947487161