Answered step by step
Verified Expert Solution
Question
1 Approved Answer
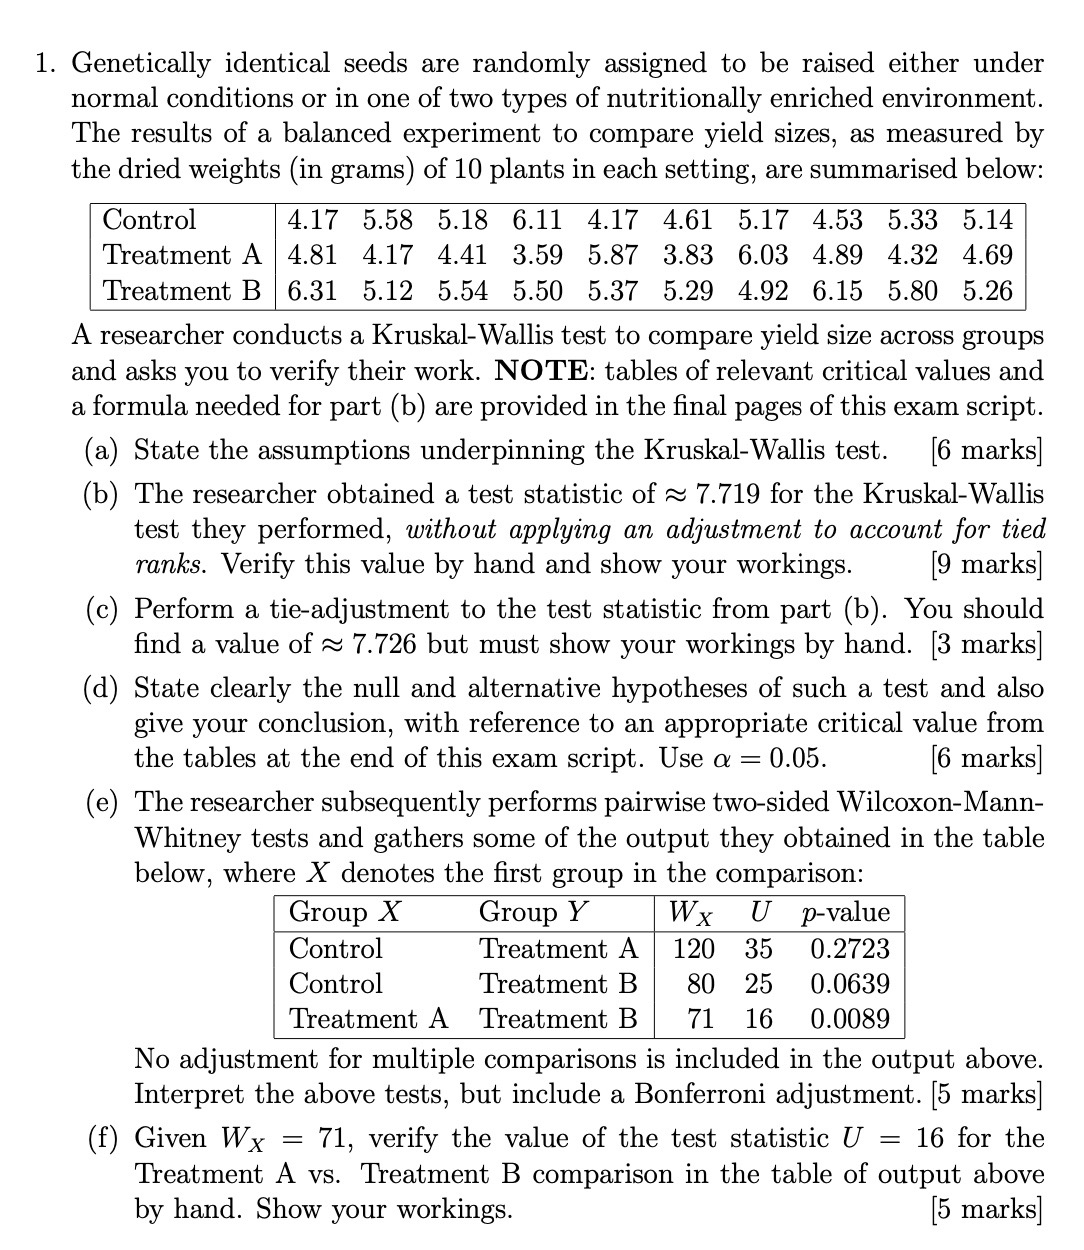
1. Genetically identical seeds are randomly assigned to be raised either under normal conditions or in one of two types of nutritionally enriched environment.

1. Genetically identical seeds are randomly assigned to be raised either under normal conditions or in one of two types of nutritionally enriched environment. The results of a balanced experiment to compare yield sizes, as measured by the dried weights (in grams) of 10 plants in each setting, are summarised below: Control 4.17 5.58 5.18 6.11 4.17 4.61 5.17 4.53 5.33 5.14 Treatment A 4.81 4.17 4.41 3.59 5.87 3.83 6.03 4.89 4.32 4.69 Treatment B 6.31 5.12 5.54 5.50 5.37 5.29 4.92 6.15 5.80 5.26 A researcher conducts a Kruskal-Wallis test to compare yield size across groups and asks you to verify their work. NOTE: tables of relevant critical values and a formula needed for part (b) are provided in the final pages of this exam script. (a) State the assumptions underpinning the Kruskal-Wallis test. [6 marks] (b) The researcher obtained a test statistic of 7.719 for the Kruskal-Wallis test they performed, without applying an adjustment to account for tied ranks. Verify this value by hand and show your workings. [9 marks] (c) Perform a tie-adjustment to the test statistic from part (b). You should find a value of 7.726 but must show your workings by hand. [3 marks] (d) State clearly the null and alternative hypotheses of such a test and also give your conclusion, with reference to an appropriate critical value from the tables at the end of this exam script. Use a = 0.05. [6 marks] (e) The researcher subsequently performs pairwise two-sided Wilcoxon-Mann- Whitney tests and gathers some of the output they obtained in the table below, where X denotes the first group in the comparison: Group X Wx U p-value Group Y Treatment A 120 35 0.2723 Control Control 80 25 0.0639 Treatment B Treatment B Treatment A 71 16 0.0089 No adjustment for multiple comparisons is included in the output above. Interpret the above tests, but include a Bonferroni adjustment. [5 marks] (f) Given Wx 71, verify the value of the test statistic U = 16 for the Treatment A vs. Treatment B comparison in the table of output above by hand. Show your workings. [5 marks]
Step by Step Solution
★★★★★
3.31 Rating (142 Votes )
There are 3 Steps involved in it
Step: 1
a The underlying presumptions of the KruskalWallis test Each groups observations stand alone from the others The information is ranked since it is ordinal The shapes of the distributions for the vario...
Get Instant Access to Expert-Tailored Solutions
See step-by-step solutions with expert insights and AI powered tools for academic success
Step: 2

Step: 3

Ace Your Homework with AI
Get the answers you need in no time with our AI-driven, step-by-step assistance
Get Started


