Question
1. Get the excel file with GDP per capita data for a cross section of countries in 1960 and 2017 (some countries are missing because
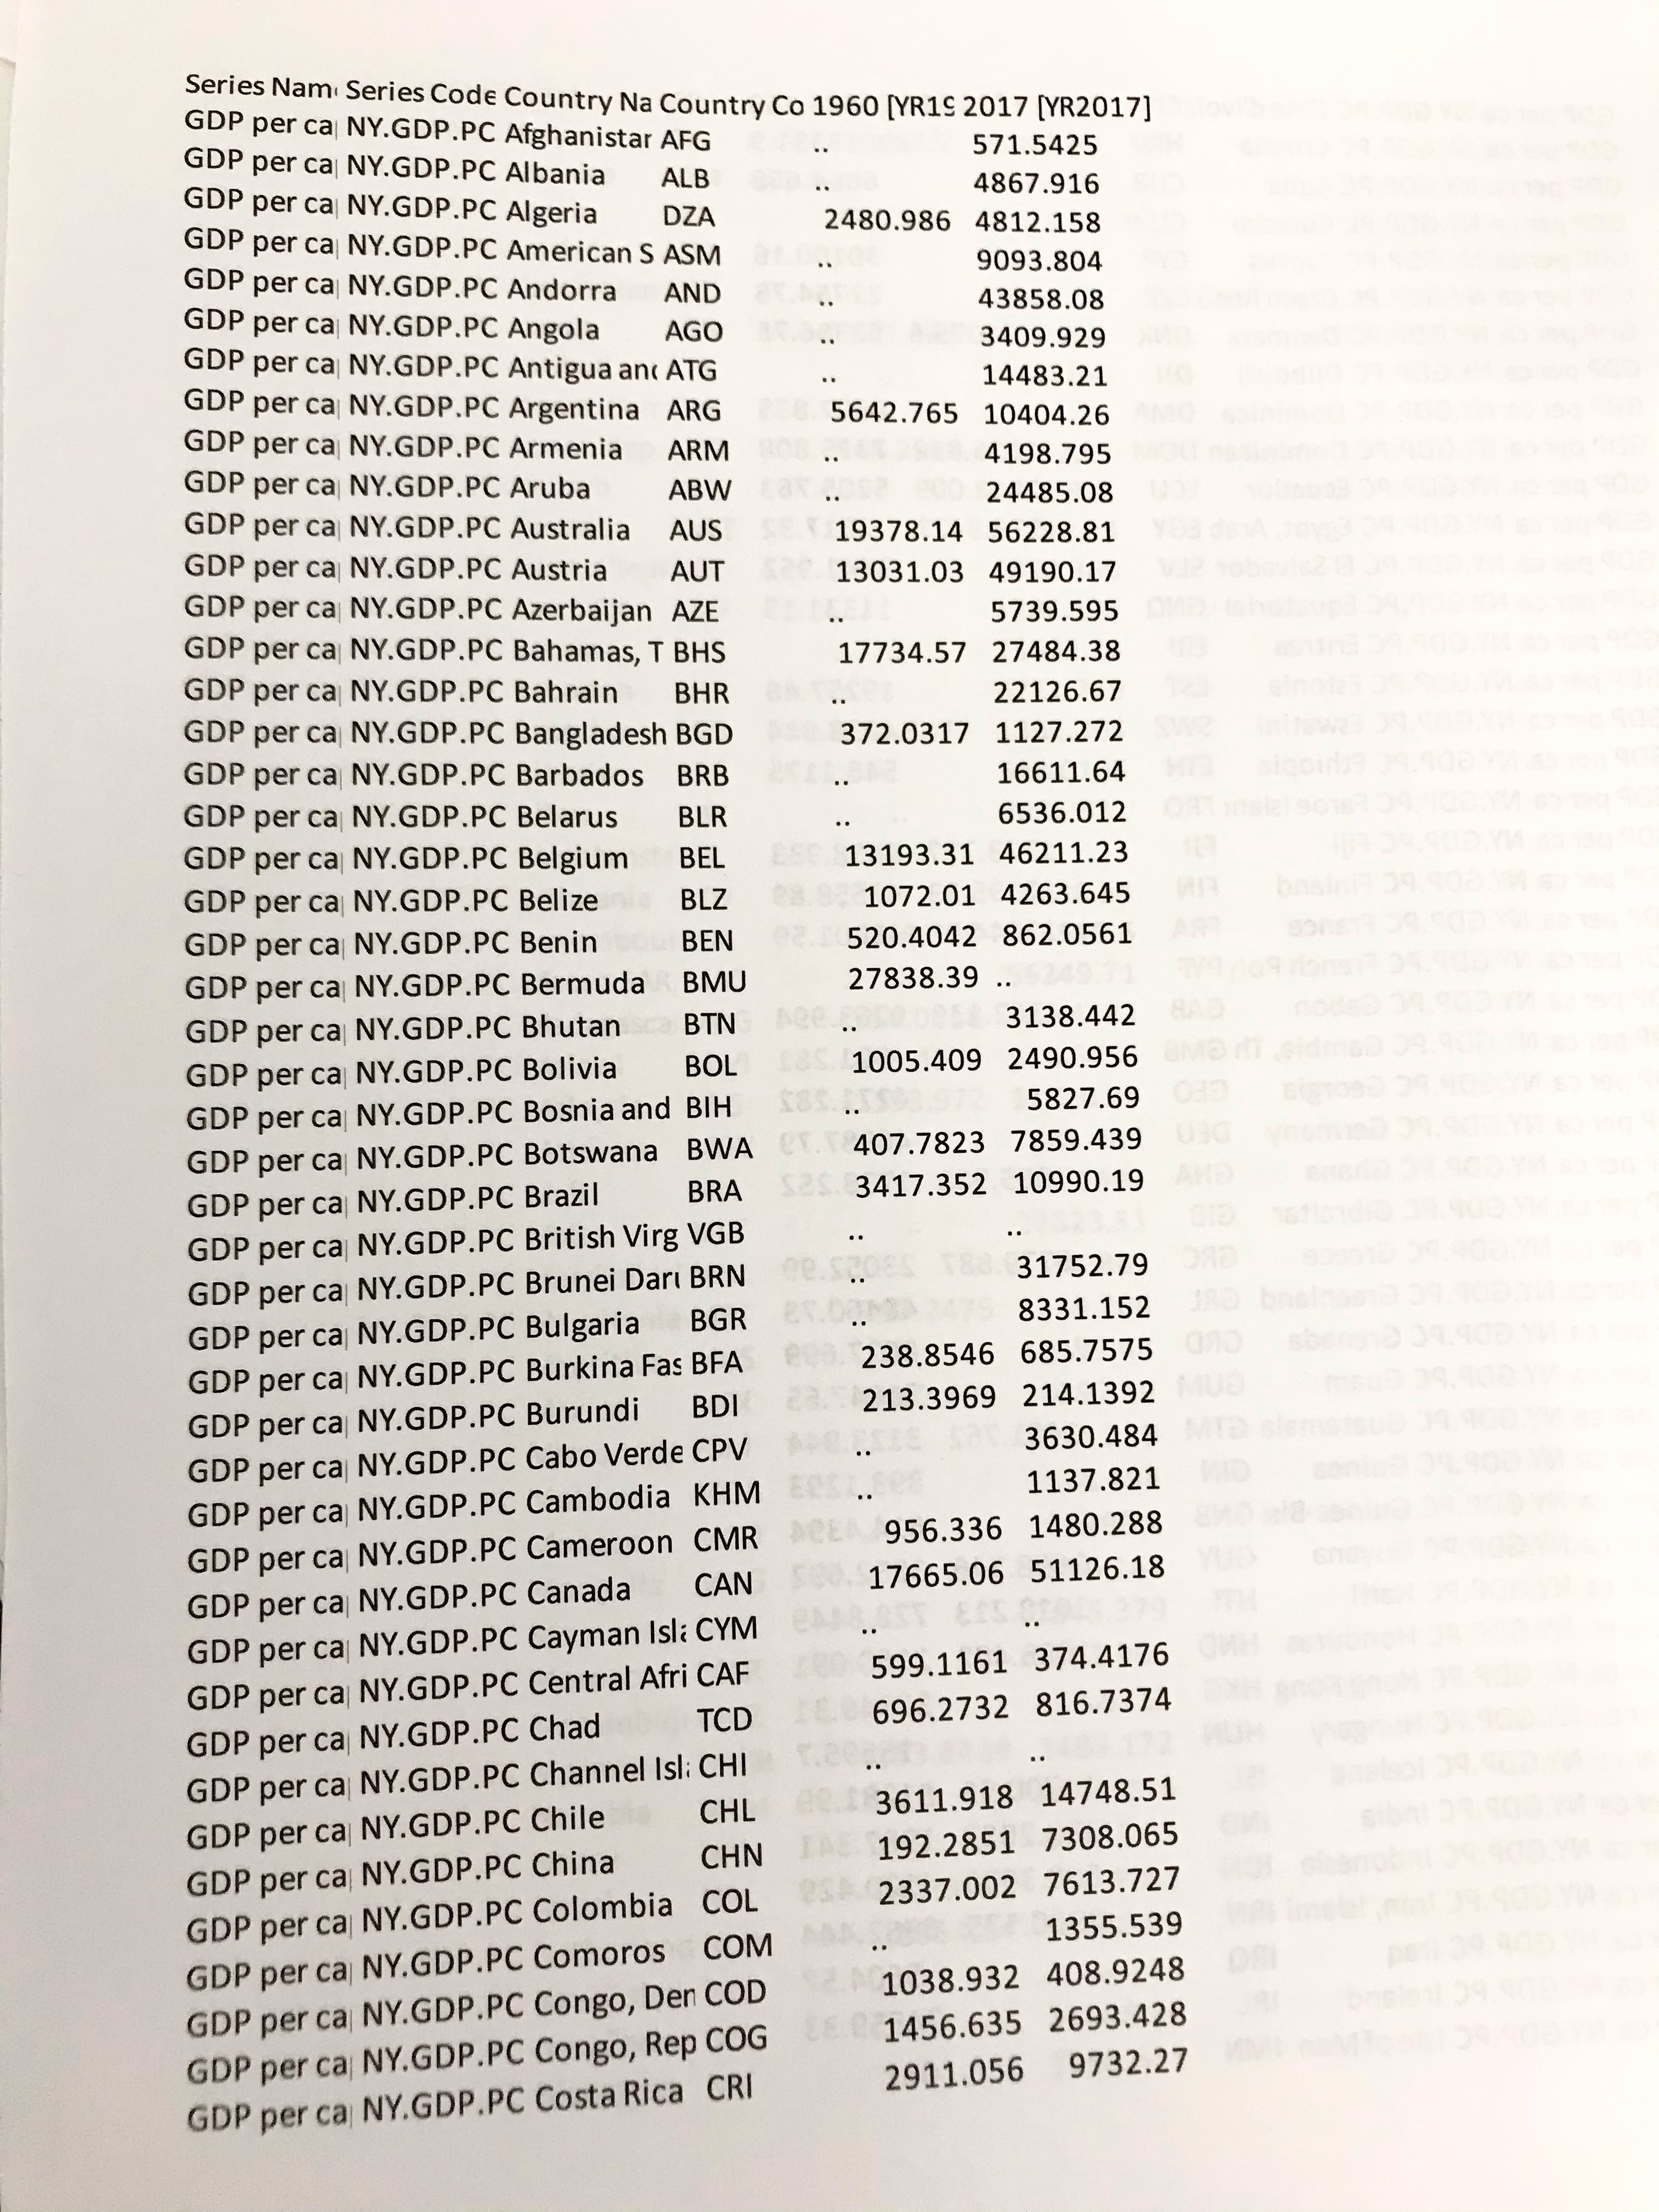
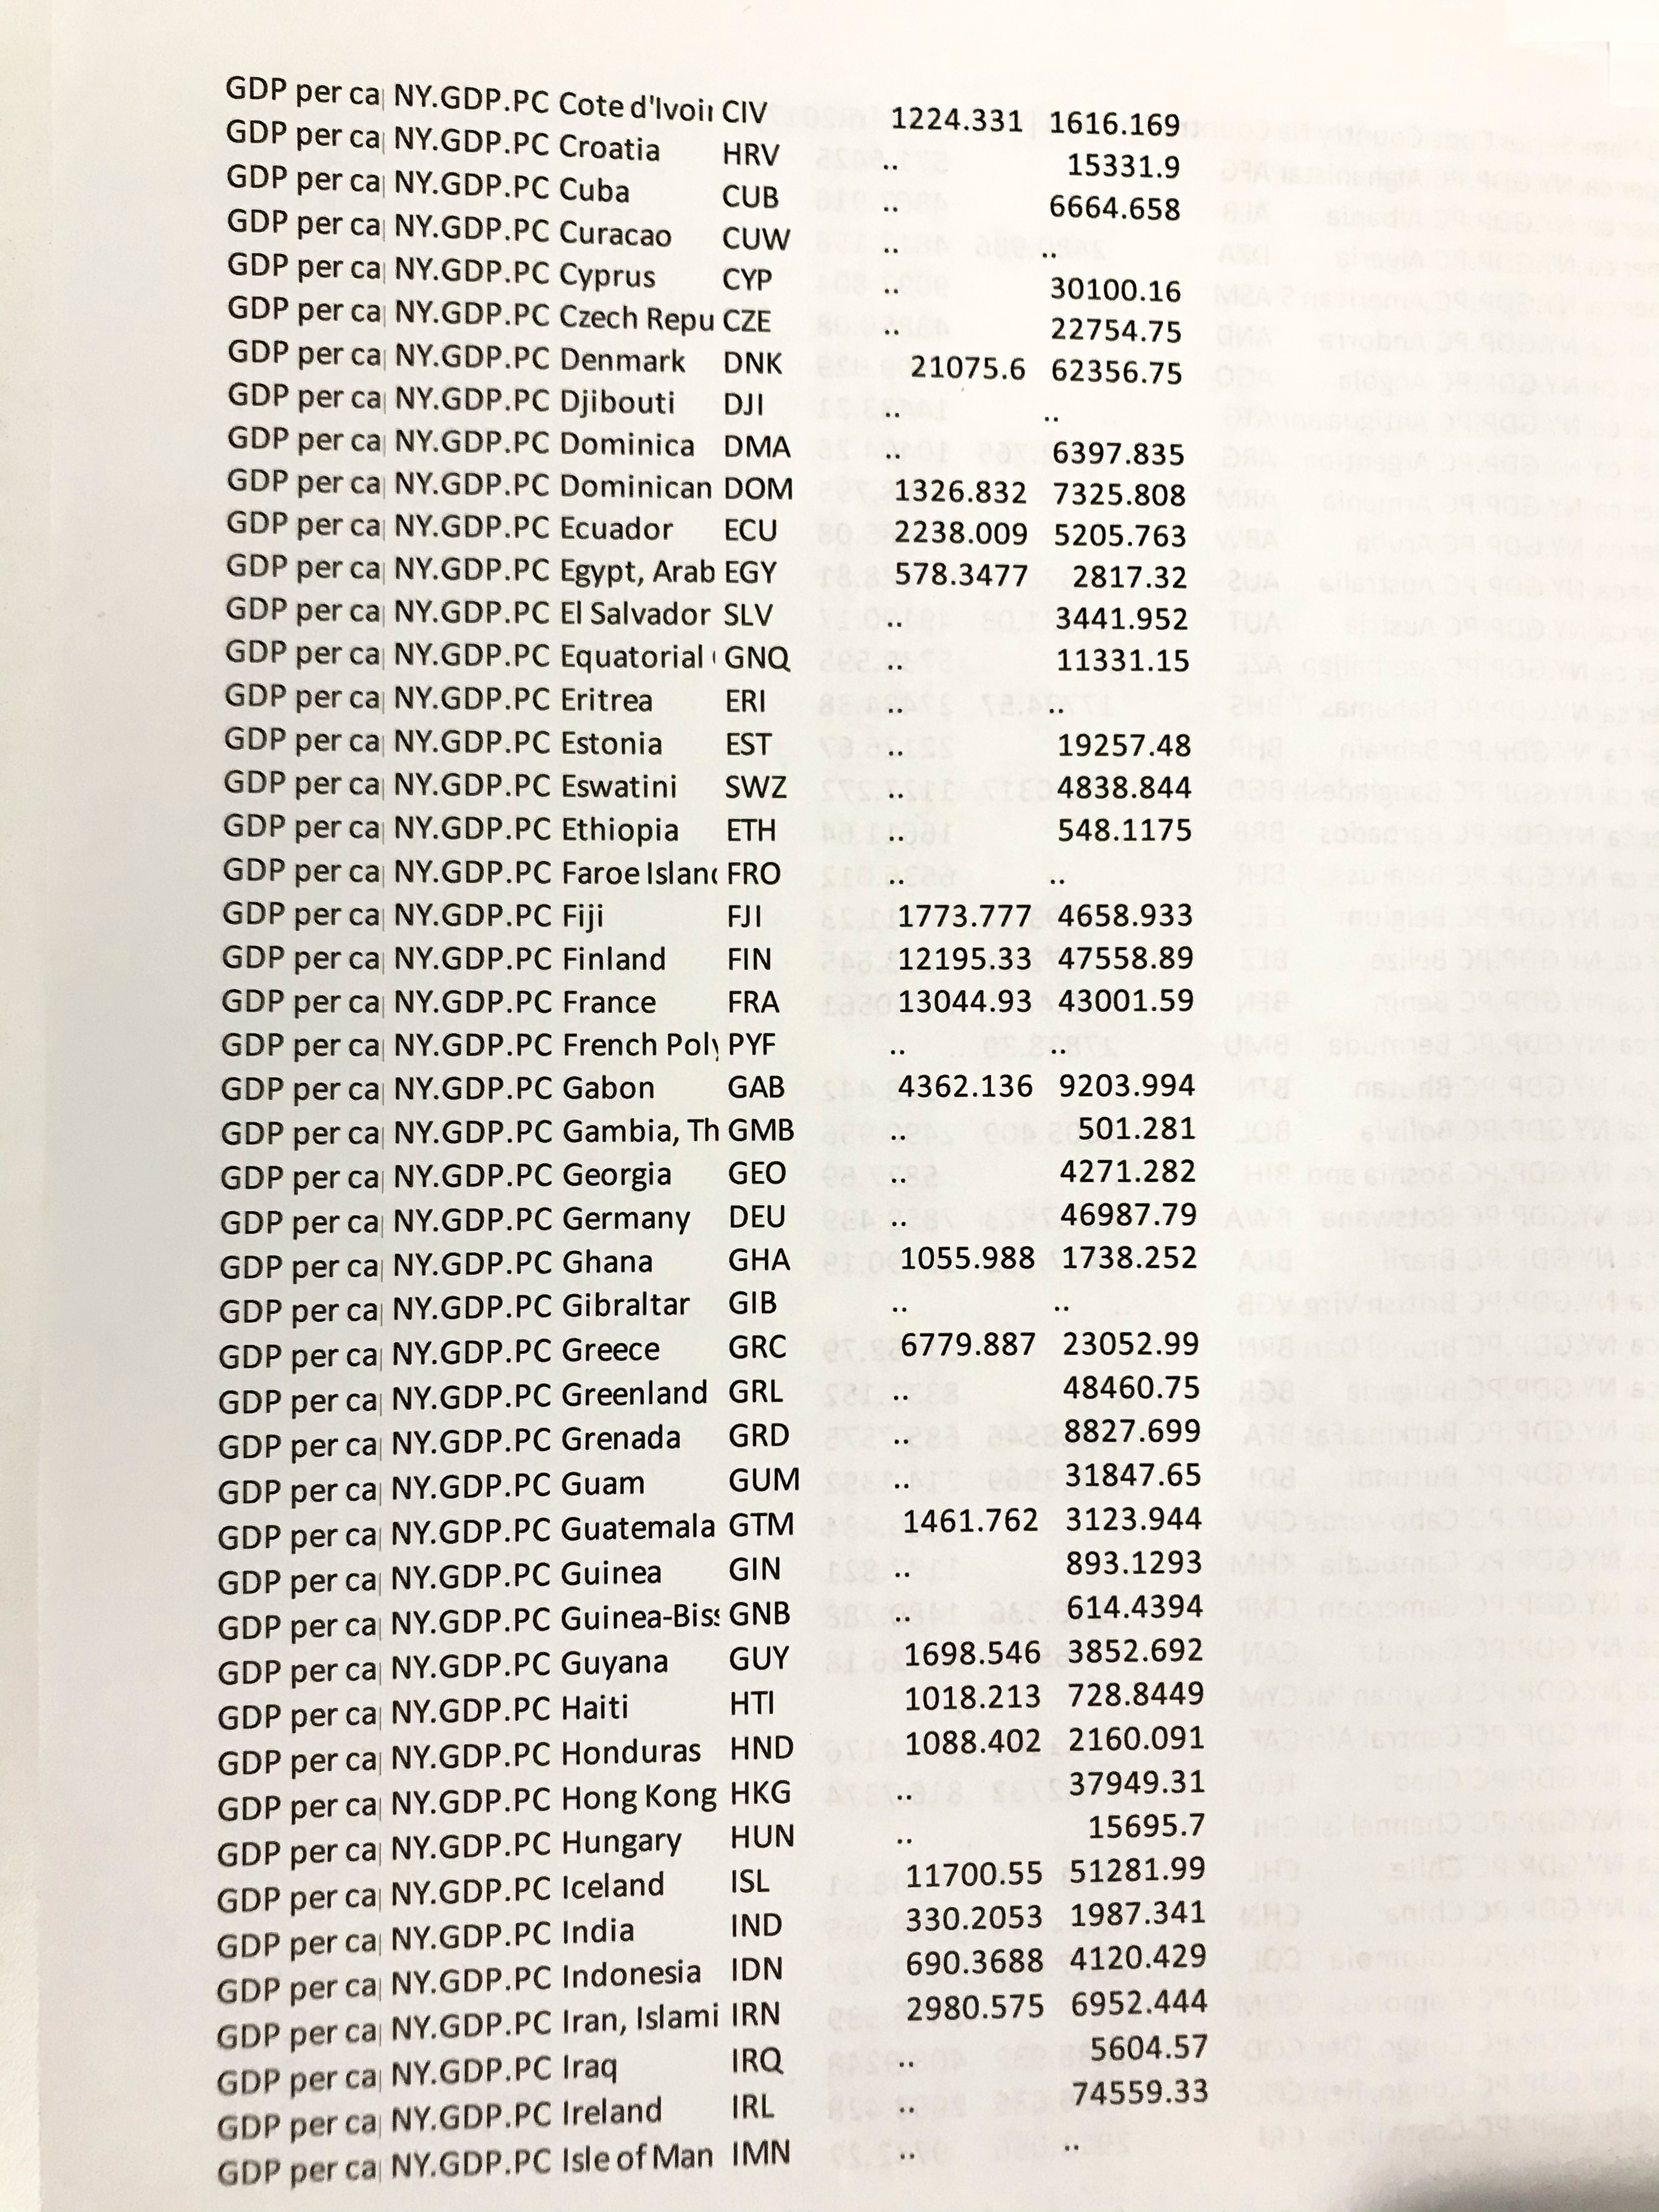
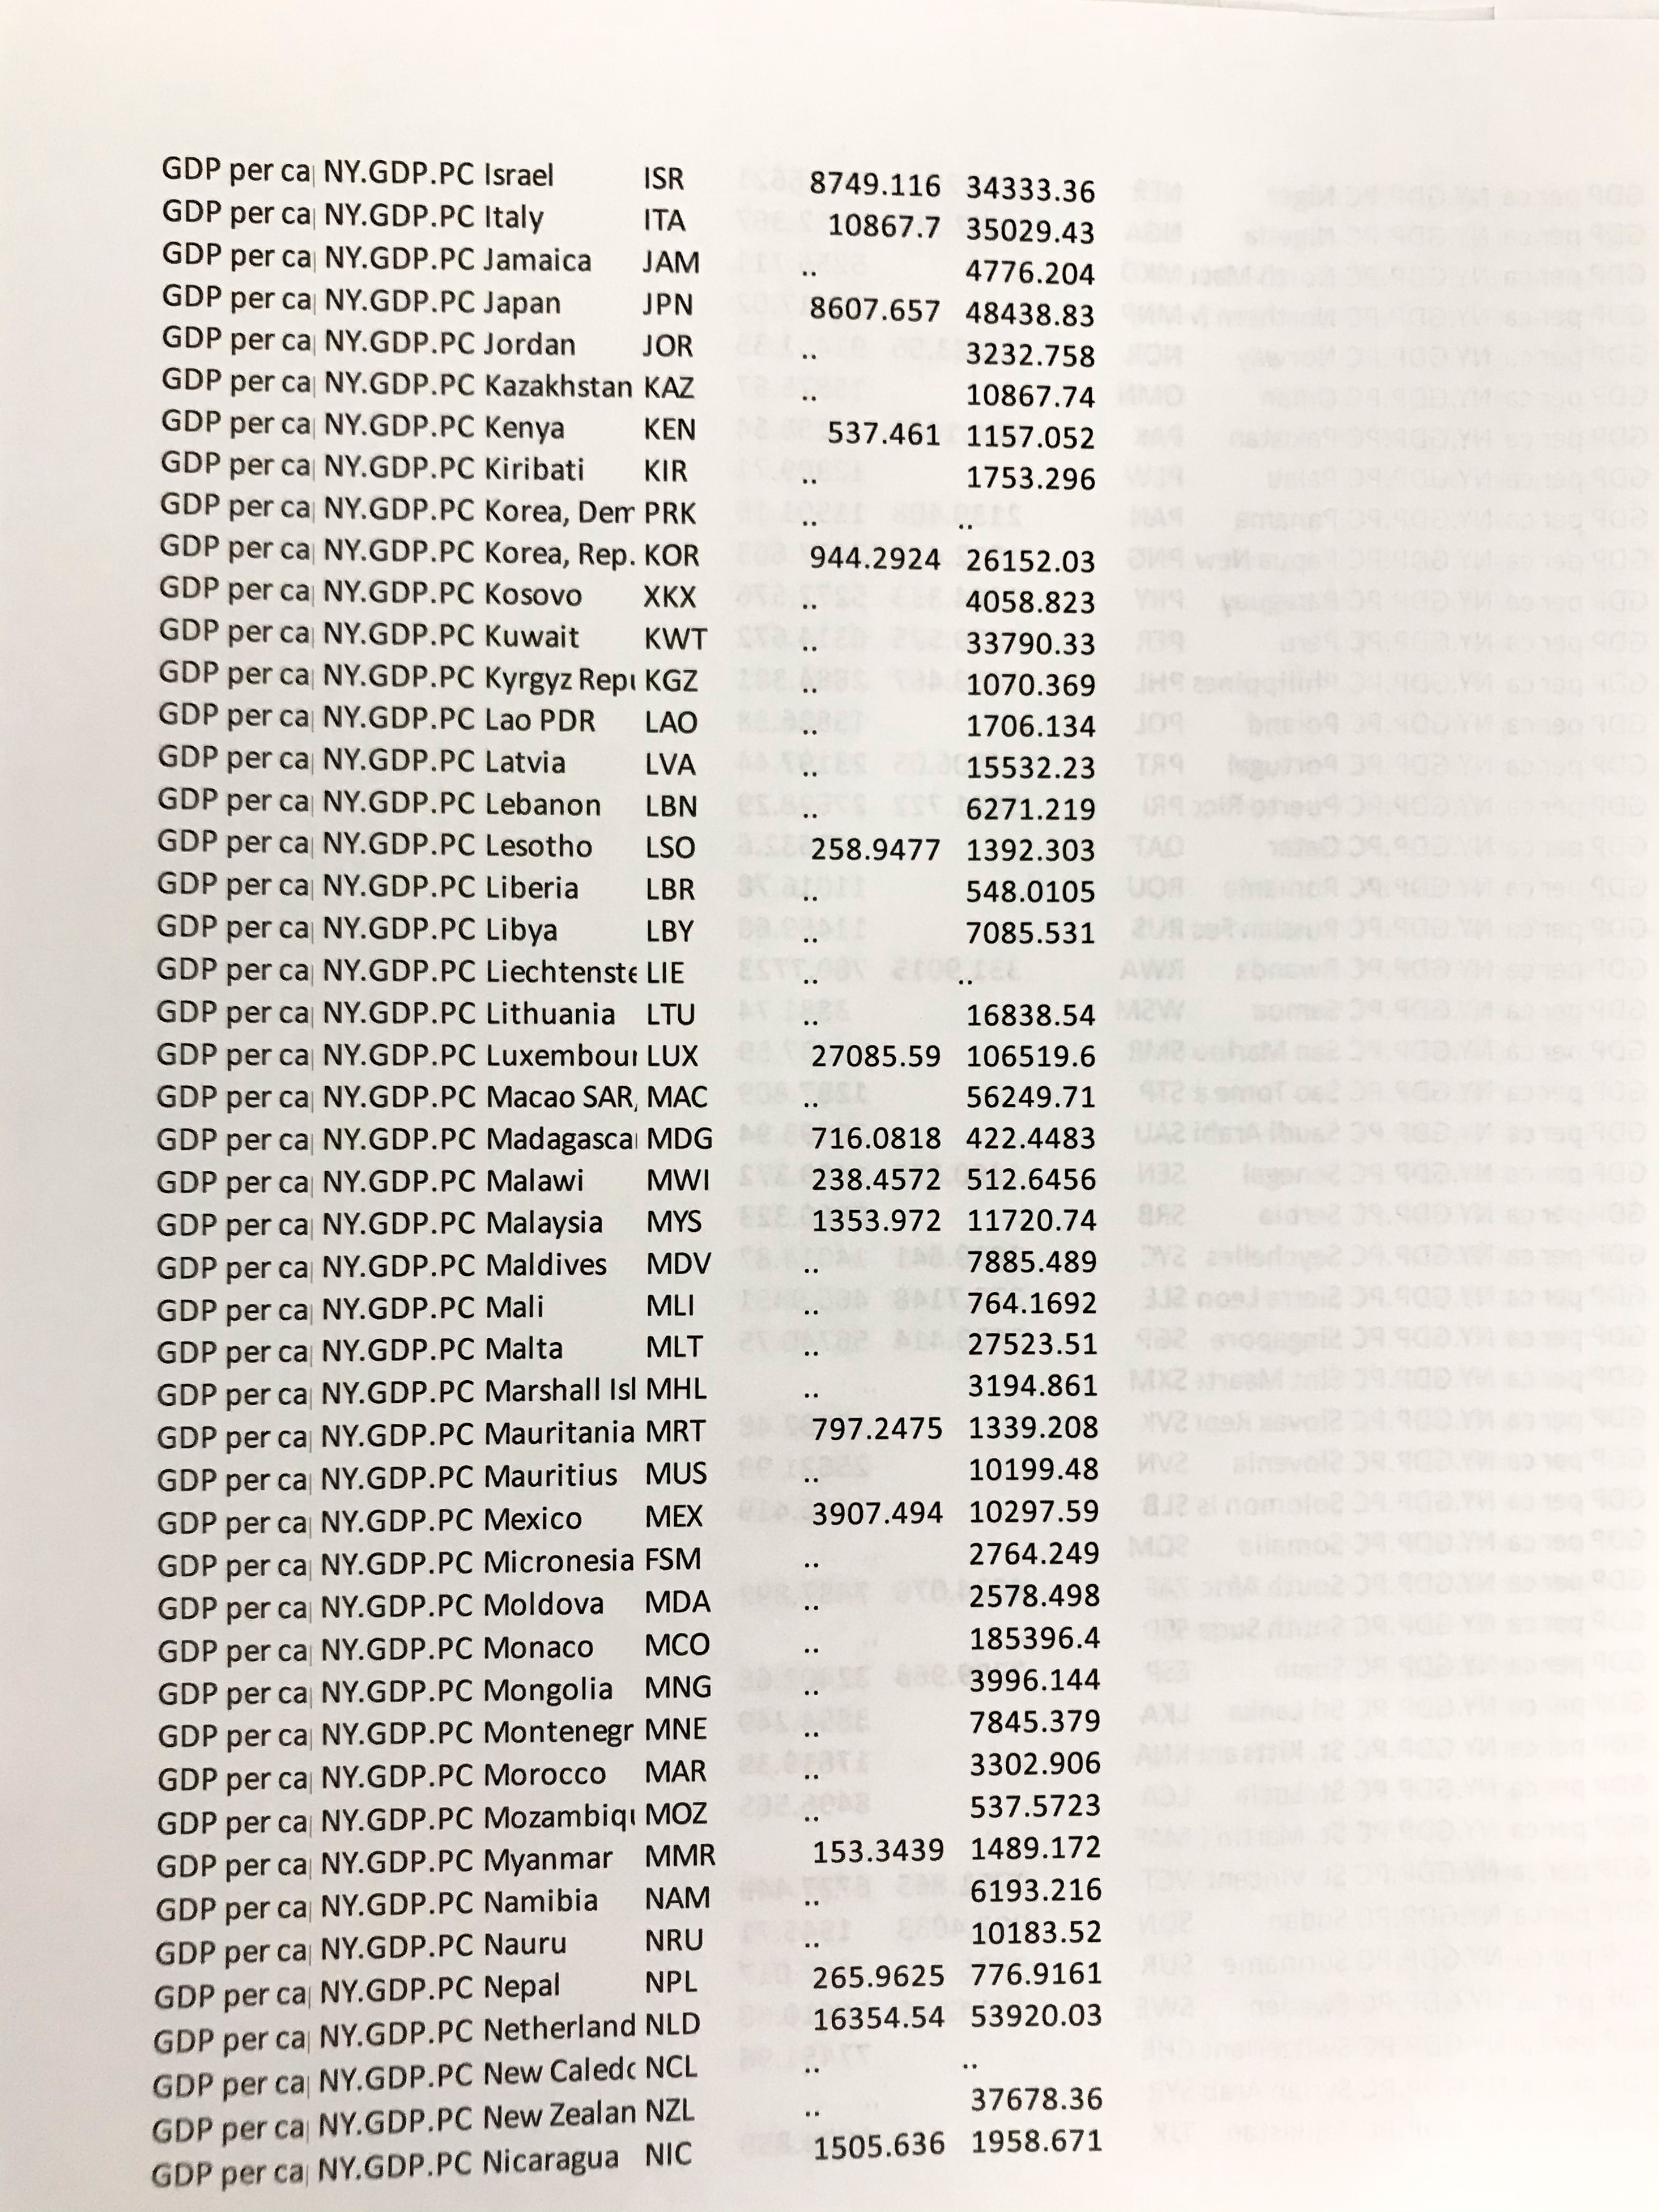
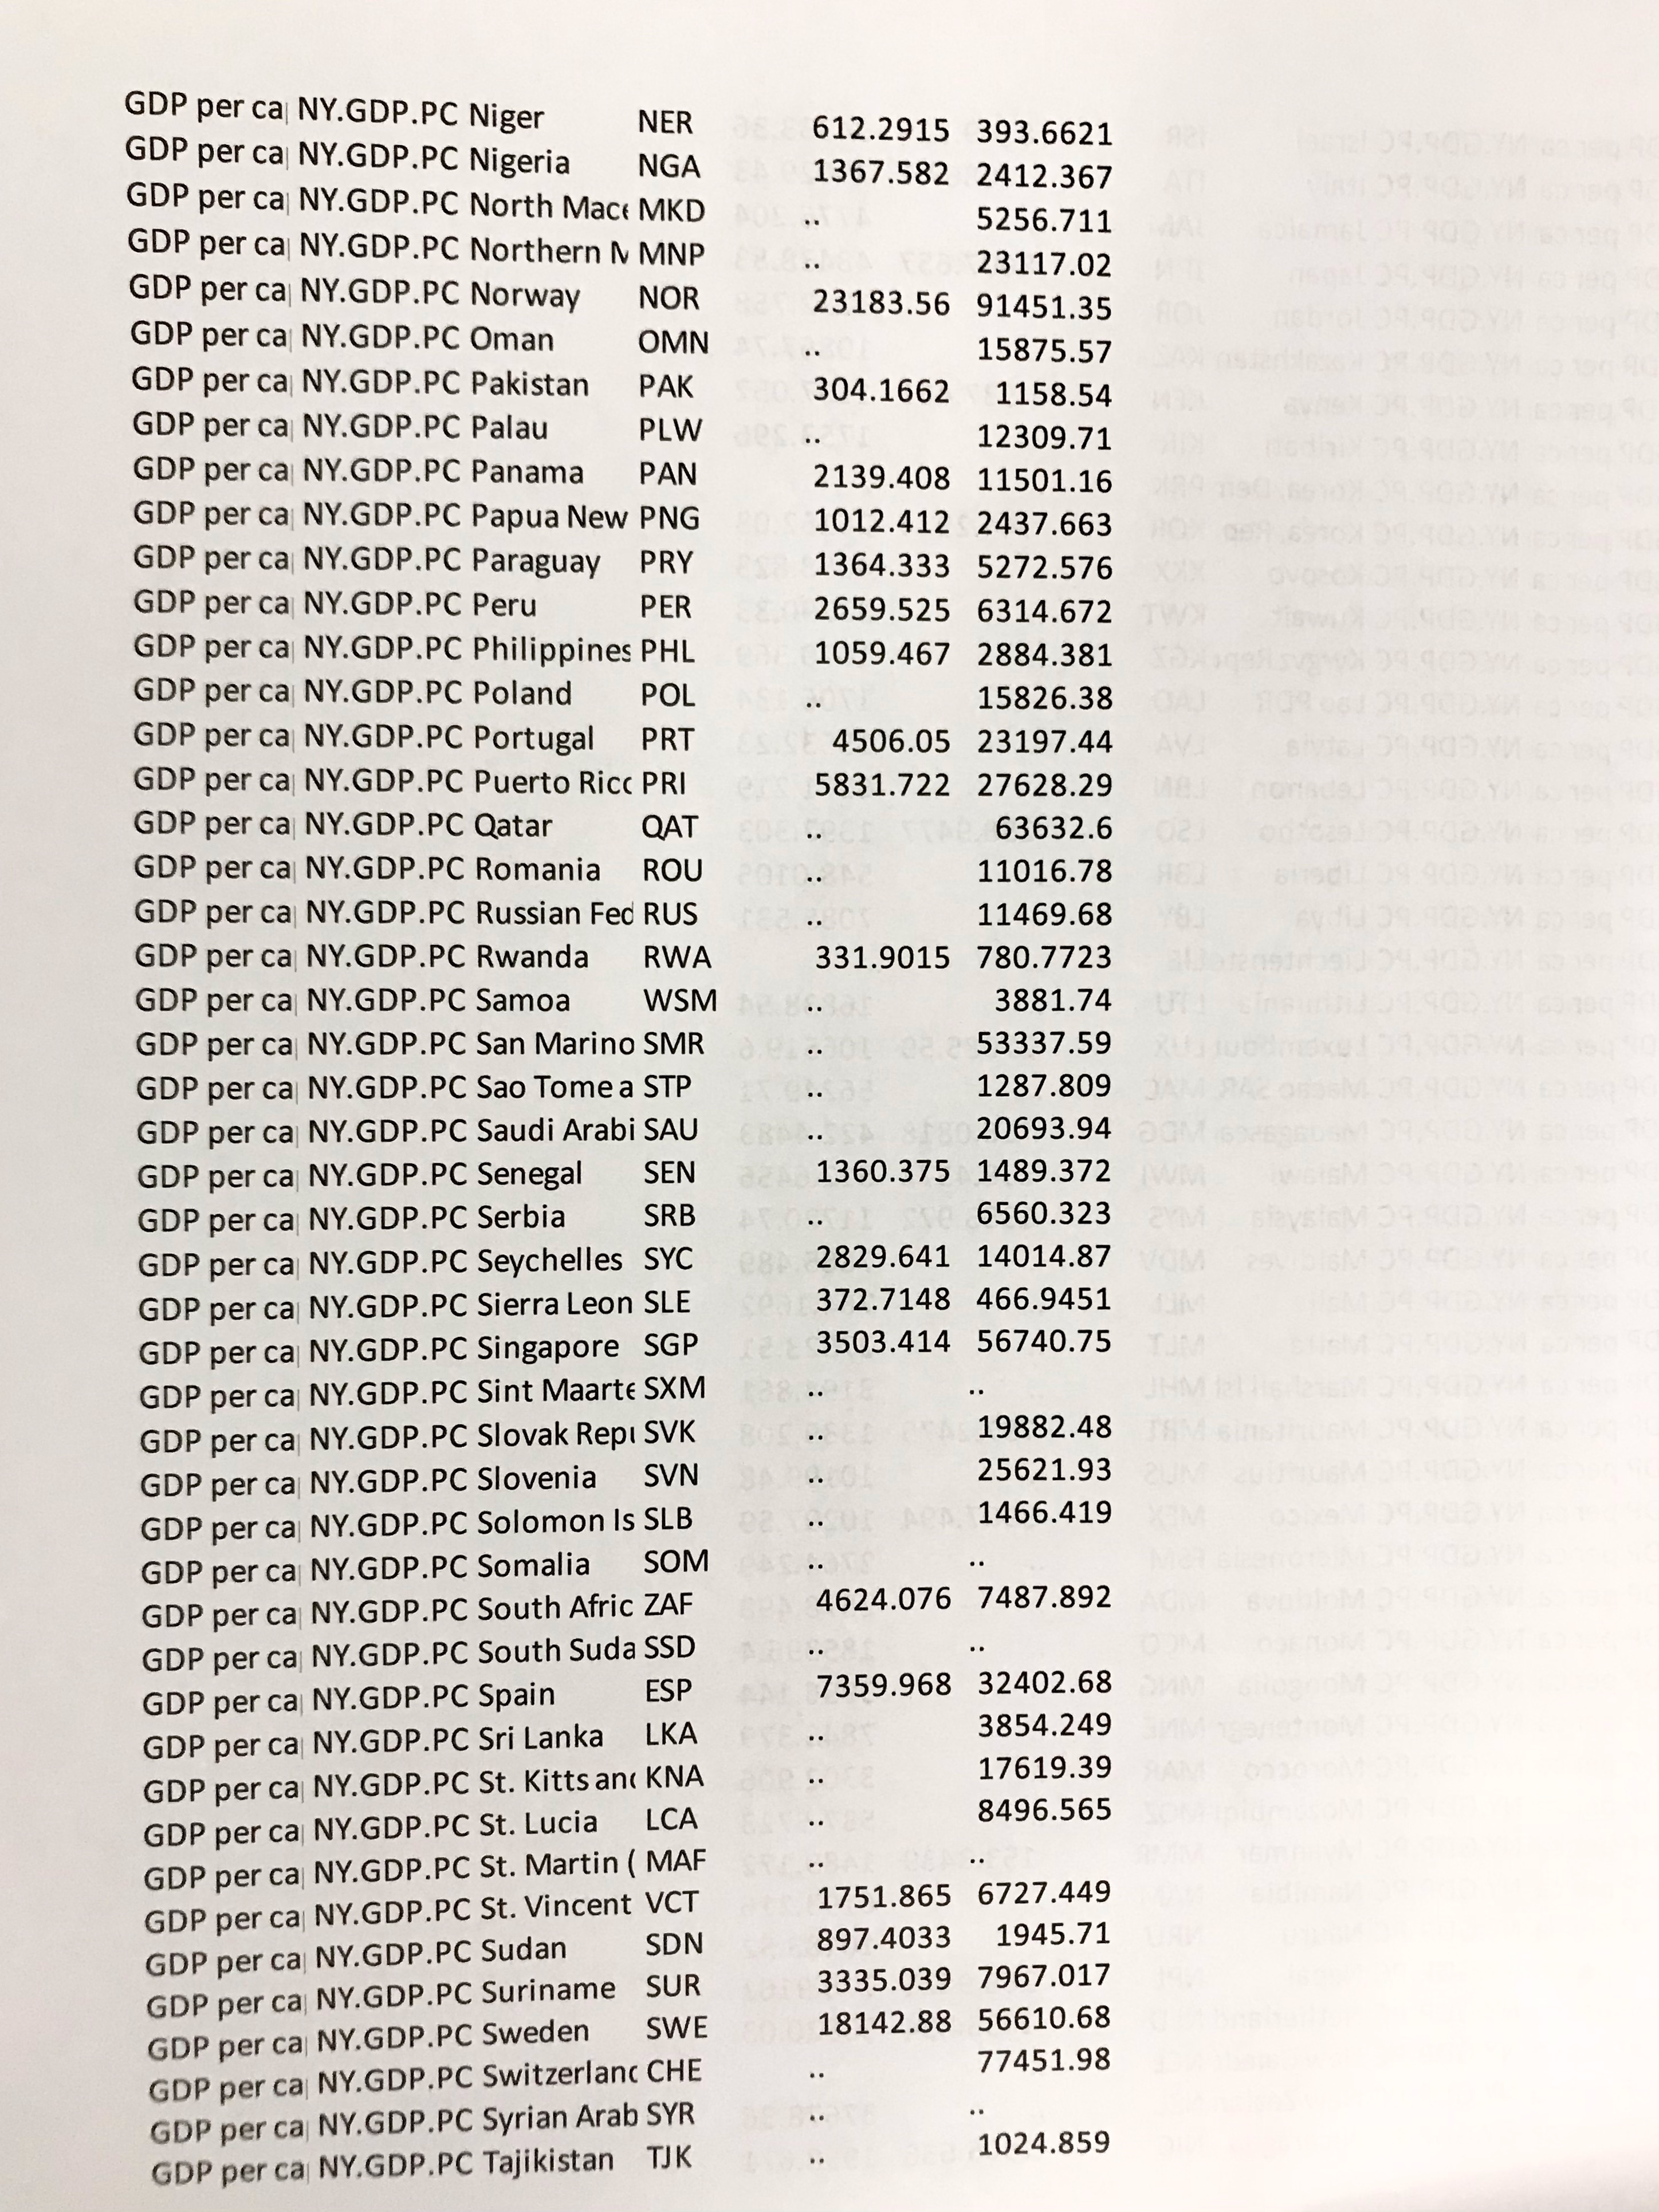
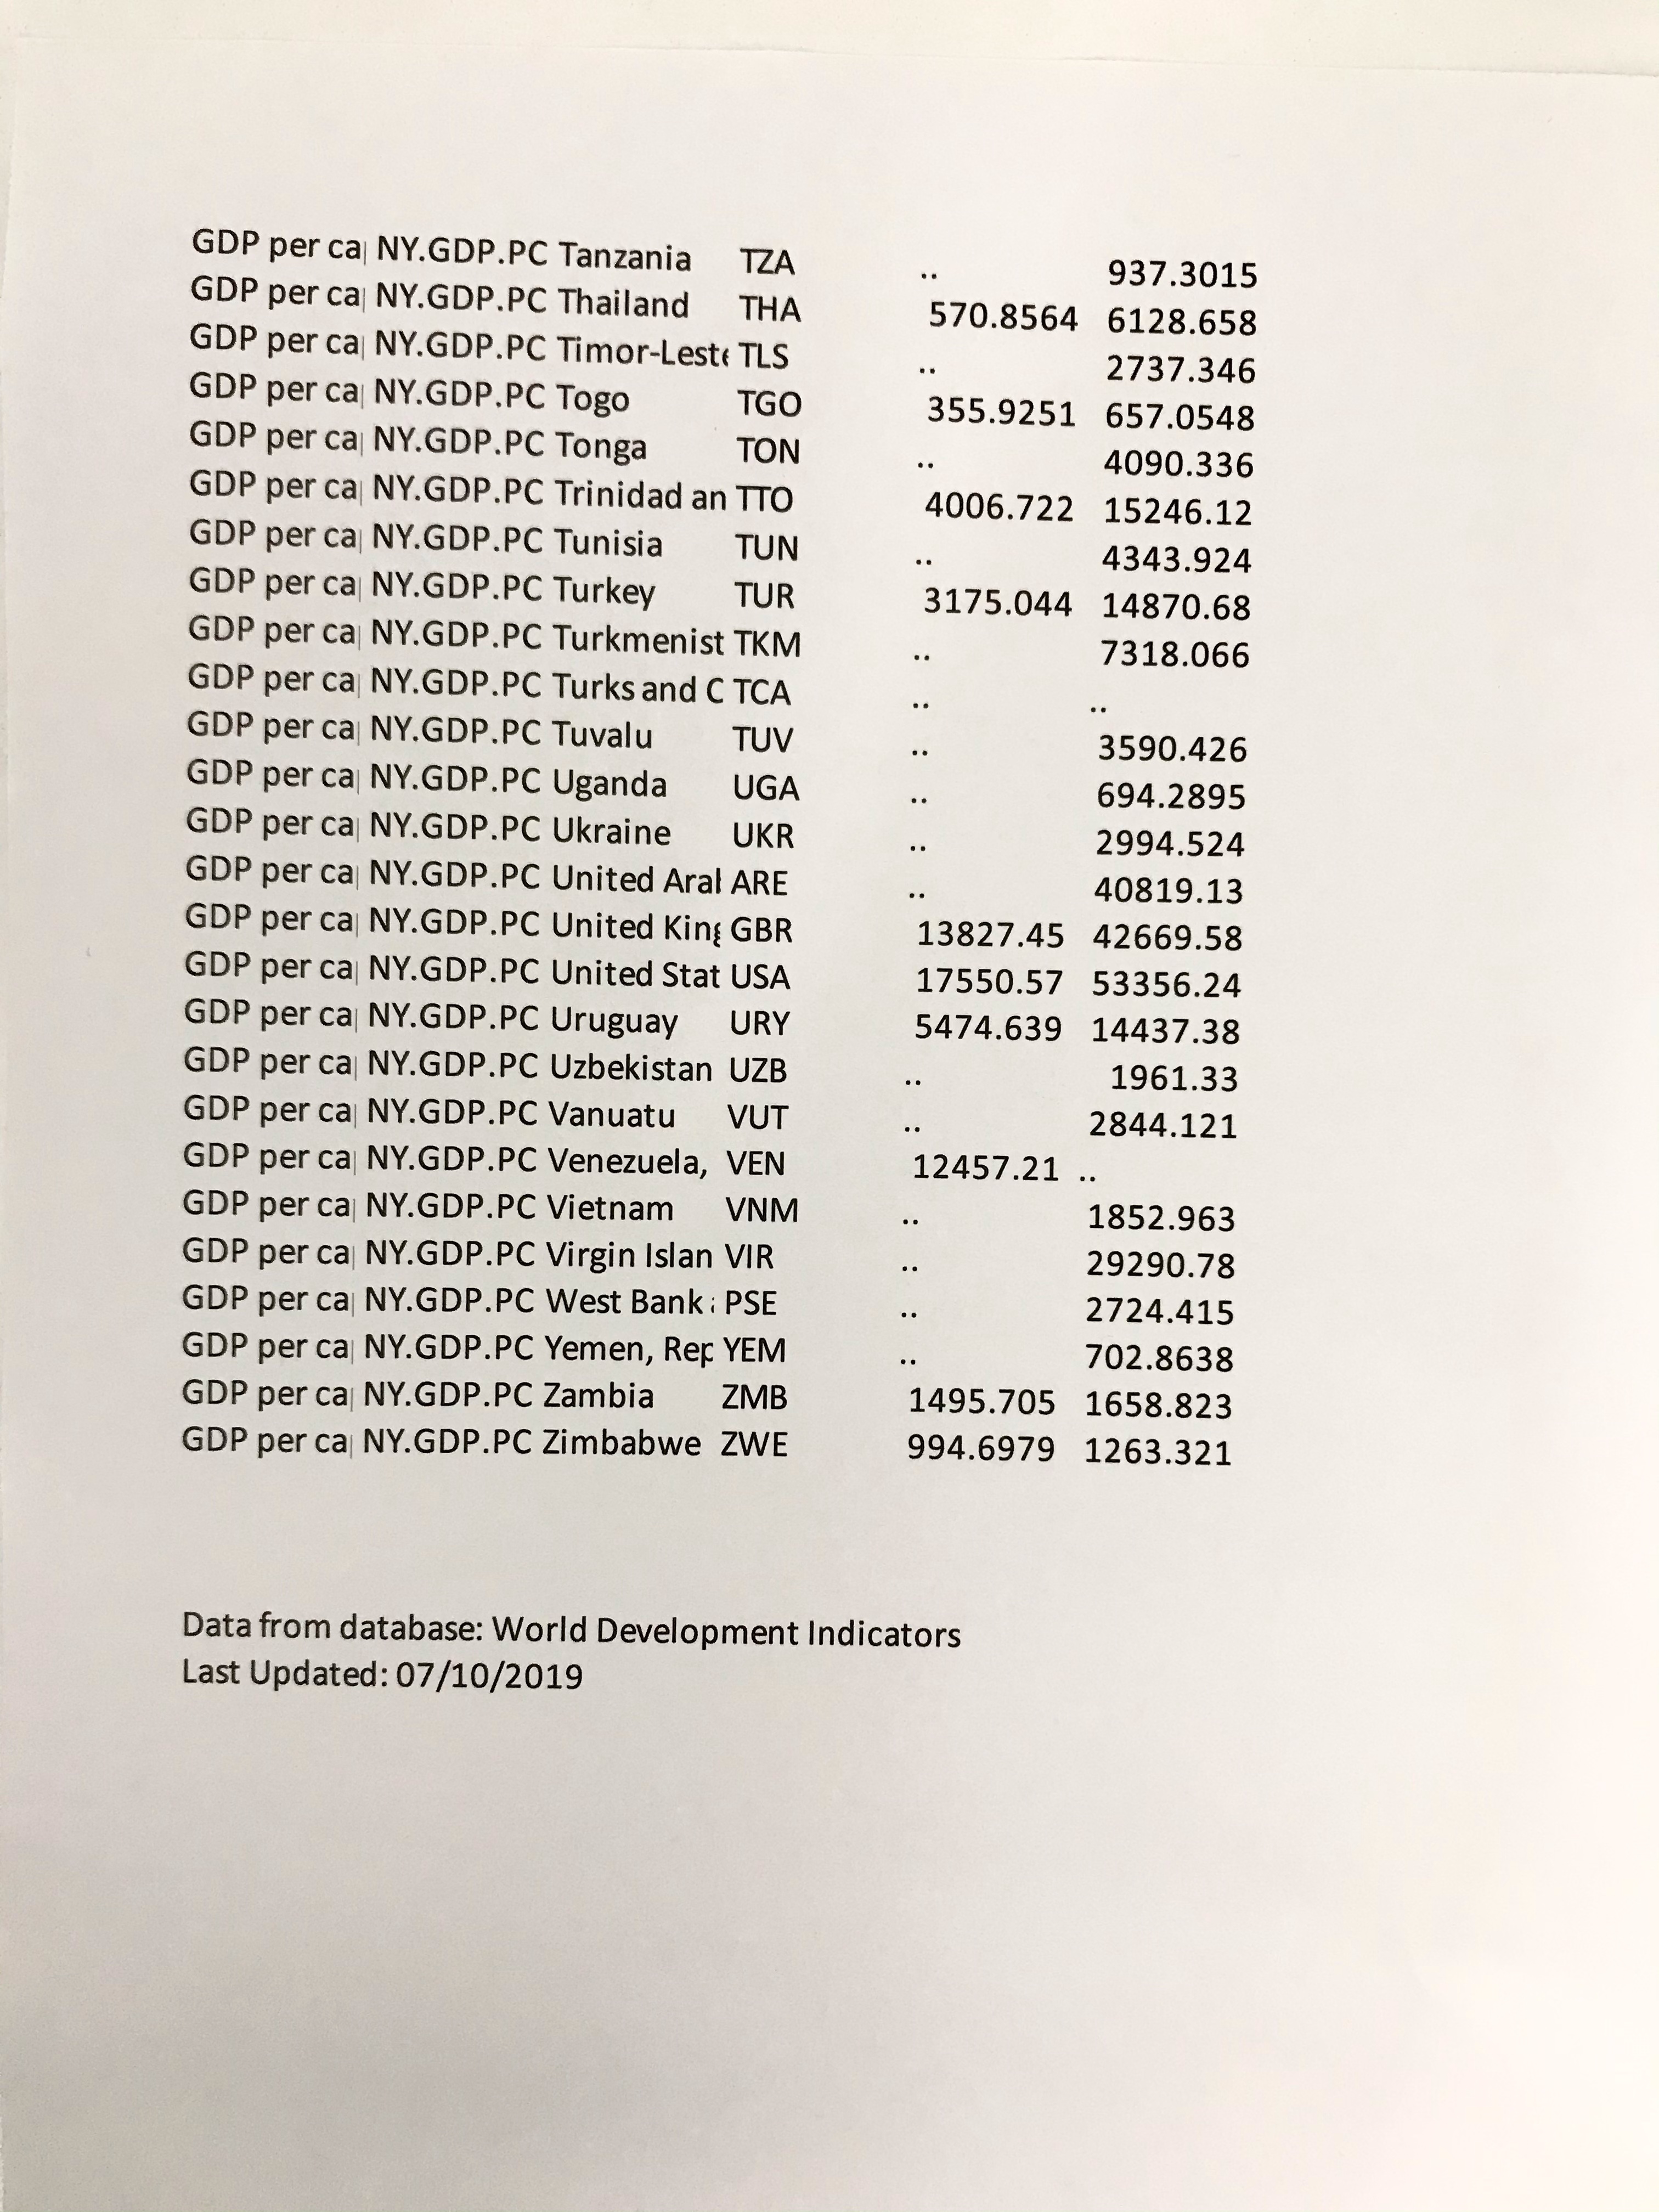
1. Get the excel file with GDP per capita data for a cross section of countries in 1960 and 2017 (some countries are missing because the data are not available). The file is available on Canvas. The source for this dataset is The World Bank (databank.workbank.org).
(a) In 2017, what are the 3 richest countries in the world? What are the 3 poorest countries in the world? (
b) In 1960, what are the 3 richest countries in the world? What are the 3 poorest countries in the world?
(c) In 1960, how many times richer was the average person of the richest country than the average person of the poorest country in the world? In 2017, how many times richer is the average person of the richest country than the average person of the poorest country in the world?
2. For the countries that have data for 1960, compute the average ANNUAL growth rate of per capita GDP between 1960 and 2017.
(a) What 3 countries have grown the MOST over this period? What 3 countries has grown the LEAST over this period?
(b) What's the average ANNUAL growth rate of GDP per capita for the United States in this data?
3. Go to the internet and find a map of world GDP per capita by country today. Compare GDP per capita differences across countries and describe what you find (in one or two sentences).
4. Why are some countries poor while others rich today? Why do some countries grow fast since 1960 while others not? Write down some of your thoughts
Step by Step Solution
There are 3 Steps involved in it
Step: 1

Get Instant Access to Expert-Tailored Solutions
See step-by-step solutions with expert insights and AI powered tools for academic success
Step: 2

Step: 3
Ace Your Homework with AI
Get the answers you need in no time with our AI-driven, step-by-step assistance
Get Started