Question
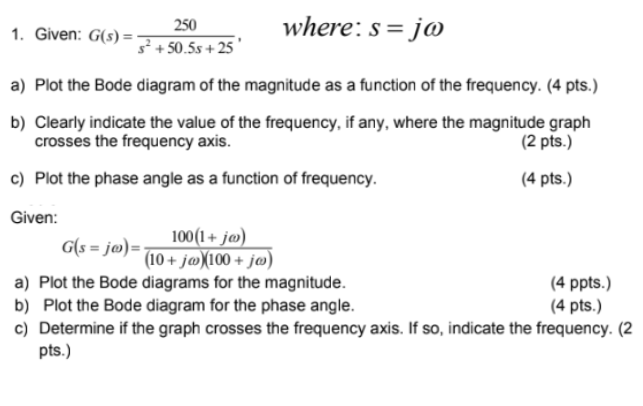
1. Given: G(s)= 250 s+50.5s+25 where: s = jo a) Plot the Bode diagram of the magnitude as a function of the frequency. (4

1. Given: G(s)= 250 s+50.5s+25 where: s = jo a) Plot the Bode diagram of the magnitude as a function of the frequency. (4 pts.) b) Clearly indicate the value of the frequency, if any, where the magnitude graph crosses the frequency axis. c) Plot the phase angle as a function of frequency. Given: G(s=jo)= 100(1+jo) (10+ jo 100+ jo) a) Plot the Bode diagrams for the magnitude. b) Plot the Bode diagram for the phase angle. (2 pts.) (4 pts.) (4 ppts.) (4 pts.) c) Determine if the graph crosses the frequency axis. If so, indicate the frequency. (2 pts.)
Step by Step Solution
There are 3 Steps involved in it
Step: 1

Get Instant Access to Expert-Tailored Solutions
See step-by-step solutions with expert insights and AI powered tools for academic success
Step: 2

Step: 3

Ace Your Homework with AI
Get the answers you need in no time with our AI-driven, step-by-step assistance
Get StartedRecommended Textbook for
Modern Control Systems
Authors: Richard C. Dorf, Robert H. Bishop
12th edition
136024580, 978-0136024583
Students also viewed these Mechanical Engineering questions
Question
Answered: 1 week ago
Question
Answered: 1 week ago
Question
Answered: 1 week ago
Question
Answered: 1 week ago
Question
Answered: 1 week ago
Question
Answered: 1 week ago
Question
Answered: 1 week ago
Question
Answered: 1 week ago
Question
Answered: 1 week ago
Question
Answered: 1 week ago
Question
Answered: 1 week ago
Question
Answered: 1 week ago
Question
Answered: 1 week ago
Question
Answered: 1 week ago
Question
Answered: 1 week ago
Question
Answered: 1 week ago
Question
Answered: 1 week ago
Question
Answered: 1 week ago
Question
Answered: 1 week ago
Question
Answered: 1 week ago
View Answer in SolutionInn App


