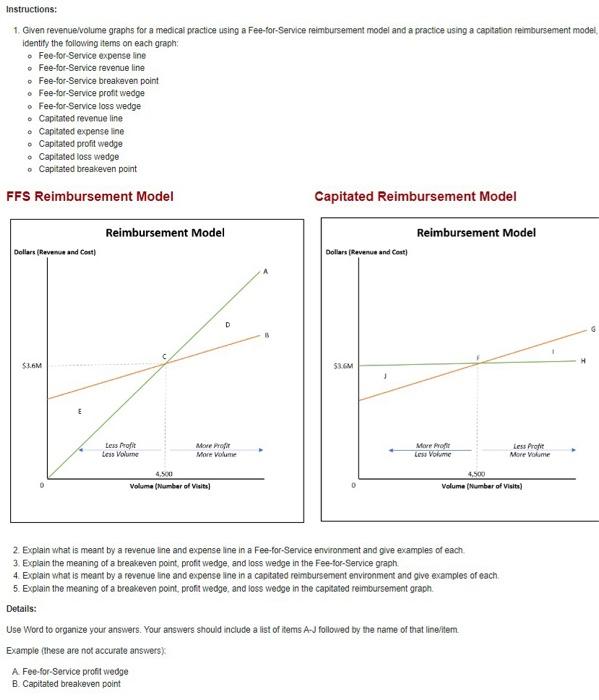
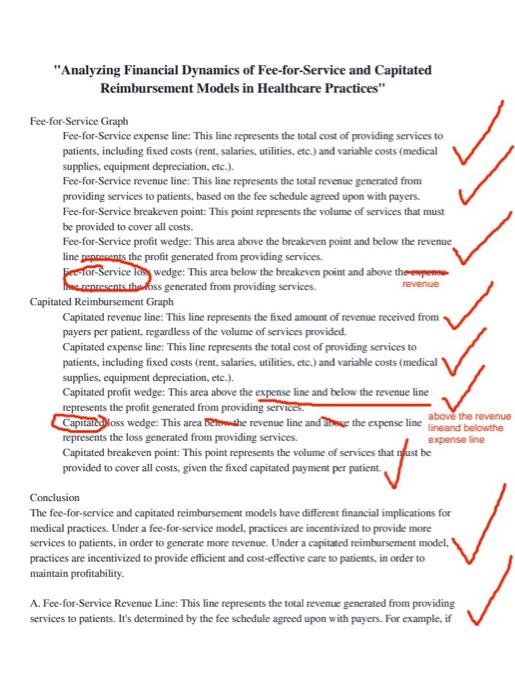
1. Given revenue/volume graphs for a medical practice using a Fee-for-Service reimbursement model and a practice using a captation reimbursement model identify the following items on each graph: - Fee-for-Service expense line - Fee-for-Service revenue line - Fee-for-Service breakeven point - Fee-for-Service profit wedge - Fee-for-Service loss wedge - Capitated revenue line - Capitated expense line - Capitated profit wedge - Capitated loss wedge - Capitated breakeven point FFS Reimbursement Model Capitated Reimbursement Model 2. Explain what is meant by a revenue ine and expense ine in a Fee-for-Service environment and give examples of each. 3. Explain the meaning of a breakeven point, proft wedge, and loss wedge in the Fee-for-Service graph. 4. Explain what is meant by a revenue line and expense line in a capitated reimbursement environment and give examples of each. 5. Explain the meaning of a breakeven point, proft wedge, and loss wedge in the captated reimbursement graph. Details: Use Word to organize your answers. Your answers should include a list of Rems A.J followed by the name of that linertem. Example (these are not accurate answers). A. Fee-for-Service profit wedge B. Capitated breakeven point "Analyzing Financial Dynamics of Fee-for-Service and Capitated Reimbursement Models in Healthcare Practices" Fee-for-Service Graph Fee-for-Service expense line: This line represents the total cost of providing services to patients, including fixed costs (rent, salaries, utilities, etc.) and variable costs (medical supplies, equipment depreciation, etc.). Fee-for-Service revenue line: This line represents the total revenue generated from providing services to patients, based on the fee schedule agreed upon with payers. Fee-for-Service breakeven point: This point represents the volume of services that must be provided to cover all costs. Fee-for-Service profit wedge: This area above the breakeven point and below the revenue line peposents the profit generated from providing services. Fenor-Service los wedge: This area below the breakeven point and above the Merenresents the 6 ss generated from providing services. Capitated Reimbursement Graph Capitated revenue line: This line represents the fixed amount of revenue received from payers per patient, regardless of the volume of services provided. Capitated expense line: This line represents the total cost of providing services to patients, including fixed costs (rent, salaries, utilities, etc.) and variable costs (medical supplies, equipment depreciation, etc.). Capitated profit wedge: This area above the expense line and below the revenue line represents the profit generated from providing services. represents the loss generated from providing services. above the reven lineand belowth Capitated breakeven point: This point represents the volume of services that nfust be provided to cover all costs, given the fixed capitated payment per patient. Conclusion The fee-for-service and capitated reimbursement models have differeat financial implications for medical practices. Under a fee-for-service model, practices are incentivized to provide more services to patients, in order to generate more revenue. Under a capitated reimbursement model, practices are incentivized to provide efficient and cost-eflective care to patients, in order to maintain profitability. A. Fee-for-Service Revenue Line: This line represents the total nevenue generated from providing services to patients. It's determined by the fee schedule agreed upon with payers. For example, if a medical practice charges $100 per visit, and it sees $0 patients in a day, then the revenue for that day would be $5,000. B. Fee-for-Service Expense Line: This line represents the total cost of providing services to patients. It includes both fixed costs (like rent, salaries, and utilities) and variable costs (like medical supplies and equipment depreciation). For example, if the total fixed and variable costs amount to $4,000 per day, this amount represents the expense line for that particular day. C. Fee-for-Service Breakeven Point: This is the volume of services that must be provided to cover all costs. For instance, if the break-even point is at 1000 patient visits per month, this means that the practice needs to provide services to 1000 patients within a month to cover all its costs. D. Fee-for-Service Profit Wedge: This area represents the profit generated from providing services, located above the breakeven point and below the revenue line on the graph. For instance, if the practice services 1200 patients in a month, the profit wedge represents the revenue generated from the additional 200 patients beyond the break-even point. E. Fee-for-Service Loss Wedge: This area represents the loss incurred from providing services, located below the breakeven point and above the expense line on the graph. For instance, if the practice services 800 patients in a month, the loss wedge represents the shortfall from the break-even point. F. Capitated revenue line: Total variable cost is calculated by multiplying variable cost per unit by the number of units produced or services provided. this is not correct G. Capitated Expense Line: Similar to the Fee-for-Service expense line, this line represents the total cost of providing services to patients, including both fixed and variable costs. For instance, if the total costs amount to $400 per patient per month, this would be represented on the capitated expense line. D. apitated profit wedge: Price per unit is determined based on market conditions and reflects what castomers are willing to pay for each unit sold or service provided. this is not the correct letter or a correct definition L. Capitated loss wedge: Contribution margin per unit is calculated by subtracting variable cost per unit from price per unit and represents how much each sale contributes towards covering fixed costs and generating profit. this is not the correct defintion of loss wedge, though " T is correct this must be a "point" on the graph--similar to how you identfied C on the fee for service ratio Cantat d breakeven point: Contribution mangin ratio is calculated by dividing contribution Inargin (price minus variable cost) by price and multiplying it by 100%. It indicates what percentige of each sale contributes towards covering fixed costs and generating profit. I do not understand what you mean by this answer-contribution margin ratio has nothing to do with breakeven point