Question
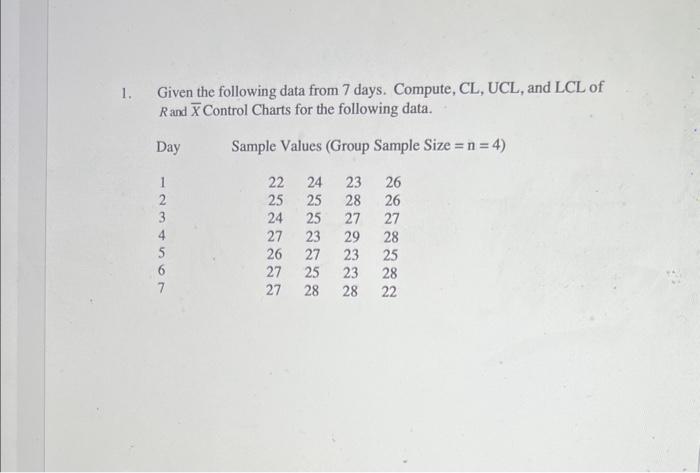
1. Given the following data from 7 days. Compute, CL, UCL, and LCL of Rand X Control Charts for the following data. Sample Values

1. Given the following data from 7 days. Compute, CL, UCL, and LCL of Rand X Control Charts for the following data. Sample Values (Group Sample Size = n = 4) 24 23 26 25 28 26 25 27 27 23 29 28 23 25 23 28 28 28 22 Day 1 2 3 5 7 22 25 24 27 26 27 27 25 27
Step by Step Solution
3.40 Rating (156 Votes )
There are 3 Steps involved in it
Step: 1

Get Instant Access to Expert-Tailored Solutions
See step-by-step solutions with expert insights and AI powered tools for academic success
Step: 2

Step: 3

Ace Your Homework with AI
Get the answers you need in no time with our AI-driven, step-by-step assistance
Get StartedRecommended Textbook for
Operations Management in the Supply Chain Decisions and Cases
Authors: Roger Schroeder, M. Johnny Rungtusanatham, Susan Goldstein
6th edition
73525243, 978-0073525242
Students also viewed these Accounting questions
Question
Answered: 1 week ago
Question
Answered: 1 week ago
Question
Answered: 1 week ago
Question
Answered: 1 week ago
Question
Answered: 1 week ago
Question
Answered: 1 week ago
Question
Answered: 1 week ago
Question
Answered: 1 week ago
Question
Answered: 1 week ago
Question
Answered: 1 week ago
Question
Answered: 1 week ago
Question
Answered: 1 week ago
Question
Answered: 1 week ago
Question
Answered: 1 week ago
Question
Answered: 1 week ago
Question
Answered: 1 week ago
Question
Answered: 1 week ago
Question
Answered: 1 week ago
Question
Answered: 1 week ago
Question
Answered: 1 week ago
Question
Answered: 1 week ago
Question
Answered: 1 week ago
View Answer in SolutionInn App


