Answered step by step
Verified Expert Solution
Question
1 Approved Answer
1. Given the following demand and supply functions of a consumer: Qd = 12-3p (Qd - Quantity demanded) Qs = 2p +2 (Qs -


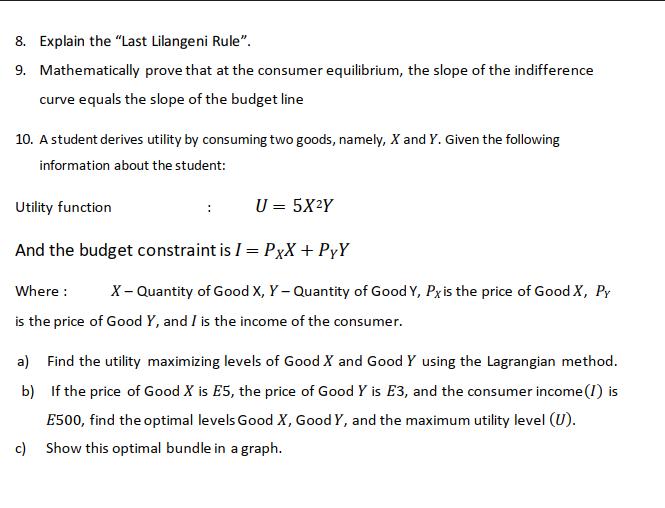
1. Given the following demand and supply functions of a consumer: Qd = 12-3p (Qd - Quantity demanded) Qs = 2p +2 (Qs - Quantity supplied) a) Graphically illustrate and mathematically show that the slope of the demand curve (Qd = 12-3p) is constant, but the price elasticity of demand varies along the curve. b) Find the market equilibrium price and quantity. Show your solution graphically. c) Calculate the consumer and producer surpluses. d) If the going price is E1, would there be an excess demand or excess supply? And how much would be the excess 2. Suppose that your firm sells 1000 units of product in a month when the price is E130 per unit. If it is known that the price elasticity of demand for the product is -0.07, how many units will your firm sell if the price were to be decreased to E120 per unit? 3. Explain why the following is impossible, with the aid of a graph a) Crossing Indifference curves solution graphically. b) Upward sloping indifference curve 4. Discuss the key features/properties of an Indifference Curve. 5. What does the slope of an Indifference Curve determine? 6. What does the slope of a budget line represent? 7. Graphically illustrate and explain the budget line in the following situations: a) Change in the consumer income. b) The price of one of the goods increases. c) Prices of both goods change i. Increase by the same proportion. ii. Increase in different proportions. d) Prices change in different directions, i.e one increases and the other decreases. 8. Explain the "Last Lilangeni Rule". 9. Mathematically prove that at the consumer equilibrium, the slope of the indifference curve equals the slope of the budget line 10. A student derives utility by consuming two goods, namely, X and Y. Given the following information about the student: U = 5XY Utility function And the budget constraint is I = PxX + PyY Where: is the price of Good Y, and I is the income of the consumer. X - Quantity of Good X, Y - Quantity of Good Y, Px is the price of Good X, Py a) Find the utility maximizing levels of Good X and Good Y using the Lagrangian method. b) If the price of Good X is E5, the price of Good Y is E3, and the consumer income (1) is E500, find the optimal levels Good X, Good Y, and the maximum utility level (U). c) Show this optimal bundle in a graph.
Step by Step Solution
★★★★★
3.39 Rating (158 Votes )
There are 3 Steps involved in it
Step: 1
1 Given the following demand and supply functions of a consumer Qd 12 3p Quantity demanded Qs 2p 2 Quantity supplied a Graphical illustration and mathematical proof that the slope of the demand curve ...
Get Instant Access to Expert-Tailored Solutions
See step-by-step solutions with expert insights and AI powered tools for academic success
Step: 2

Step: 3

Ace Your Homework with AI
Get the answers you need in no time with our AI-driven, step-by-step assistance
Get Started


