Answered step by step
Verified Expert Solution
Question
1 Approved Answer
1. Go to the tab labeled Torque Height. This tab shows the results of the model using Torque and Height to predict AvgMPG that


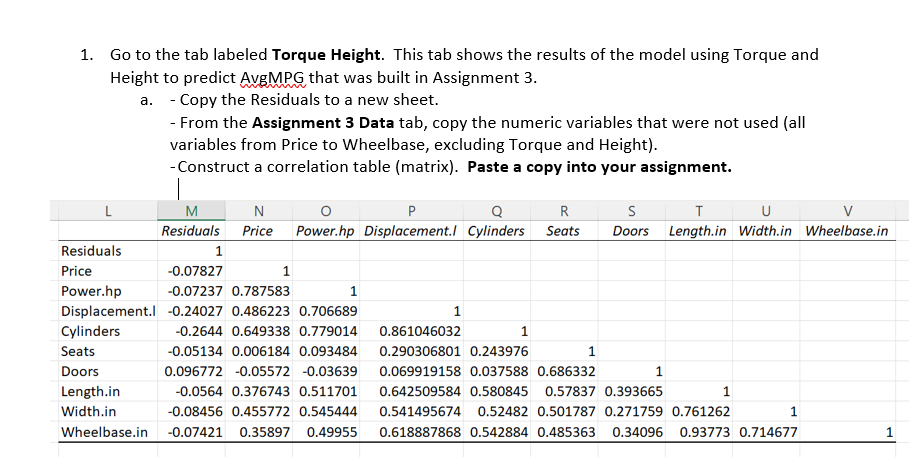
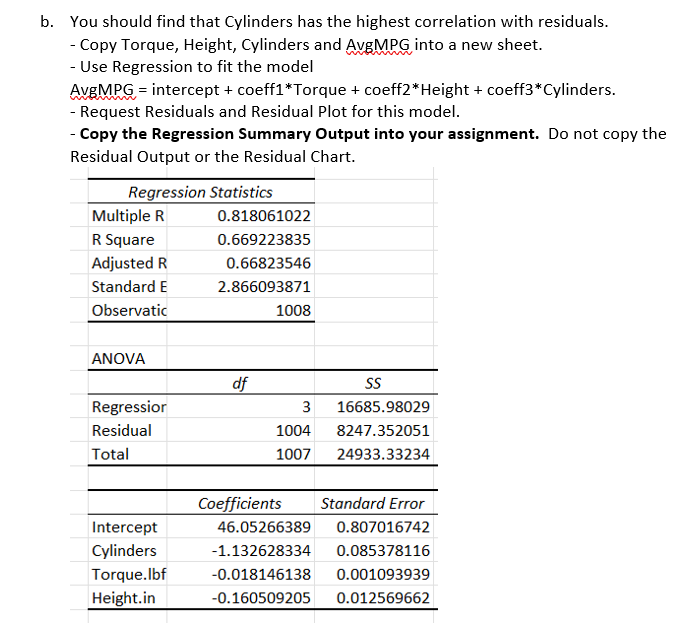
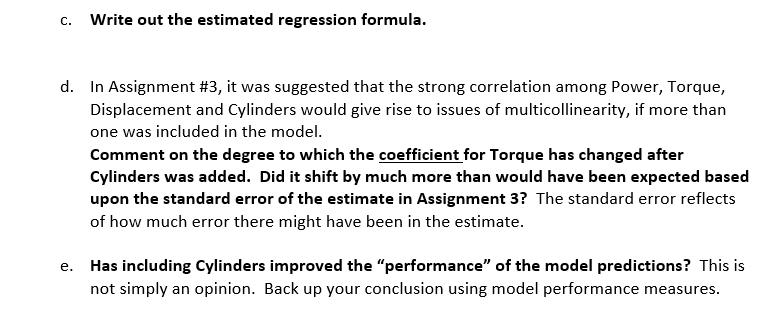
1. Go to the tab labeled Torque Height. This tab shows the results of the model using Torque and Height to predict AvgMPG that was built in Assignment 3. a. - Copy the Residuals to a new sheet. L Residuals Price Power.hp Displacement. Cylinders Seats Doors - From the Assignment 3 Data tab, copy the numeric variables that were not used (all variables from Price to Wheelbase, excluding Torque and Height). -Construct a correlation table (matrix). Paste a copy into your assignment. N P R S T U V M Residuals Price Power.hp Displacement. Cylinders Seats Doors Length.in Width.in Wheelbase.in 1 -0.07827 1 -0.07237 0.787583 -0.24027 0.486223 0.706689 -0.2644 0.649338 0.779014 0.861046032 -0.05134 0.006184 0.093484 0.290306801 0.243976 0.096772 -0.05572 -0.03639 0.069919158 0.037588 0.686332 -0.0564 0.376743 0.511701 0.642509584 0.580845 0.57837 0.393665 Width.in -0.08456 0.455772 0.545444 0.541495674 0.52482 0.501787 0.271759 0.761262 Wheelbase.in -0.07421 0.35897 0.49955 0.618887868 0.542884 0.485363 0.34096 0.93773 0.714677 1 Length.in 1 1 1 1 1 1 1 b. You should find that Cylinders has the highest correlation with residuals. - Copy Torque, Height, Cylinders and AvgMPG into a new sheet. - Use Regression to fit the model Avg MPG = intercept + coeff1* Torque + coeff2 * Height + coeff3*Cylinders. - Request Residuals and Residual Plot for this model. - Copy the Regression Summary Output into your assignment. Do not copy the Residual Output or the Residual Chart. Regression Statistics Multiple R R Square Adjusted R Standard E Observatic 19 ANOVA Regression Residual Total 0.818061022 0.669223835 0.66823546 2.866093871 Intercept Cylinders df 1008 3 1004 1007 SS 16685.98029 8247.352051 24933.33234 Coefficients Standard Error 46.05266389 0.807016742 -1.132628334 0.085378116 Torque.lbf -0.018146138 0.001093939 Height.in -0.160509205 0.012569662 C. Write out the estimated regression formula. d. In Assignment #3, it was suggested that the strong correlation among Power, Torque, Displacement and Cylinders would give rise to issues of multicollinearity, if more than one was included in the model. Comment on the degree to which the coefficient for Torque has changed after Cylinders was added. Did it shift by much more than would have been expected based upon the standard error of the estimate in Assignment 3? The standard error reflects of how much error there might have been in the estimate. e. Has including Cylinders improved the "performance" of the model predictions? This is not simply an opinion. Back up your conclusion using model performance measures.
Step by Step Solution
There are 3 Steps involved in it
Step: 1
a To construct a correlation table matrix you need to copy the relevant data and calculate the correlation coefficients Here is the correlation table ...
Get Instant Access to Expert-Tailored Solutions
See step-by-step solutions with expert insights and AI powered tools for academic success
Step: 2

Step: 3

Ace Your Homework with AI
Get the answers you need in no time with our AI-driven, step-by-step assistance
Get Started


