

Answered step by step
Verified Expert Solution
Question
1 Approved Answer
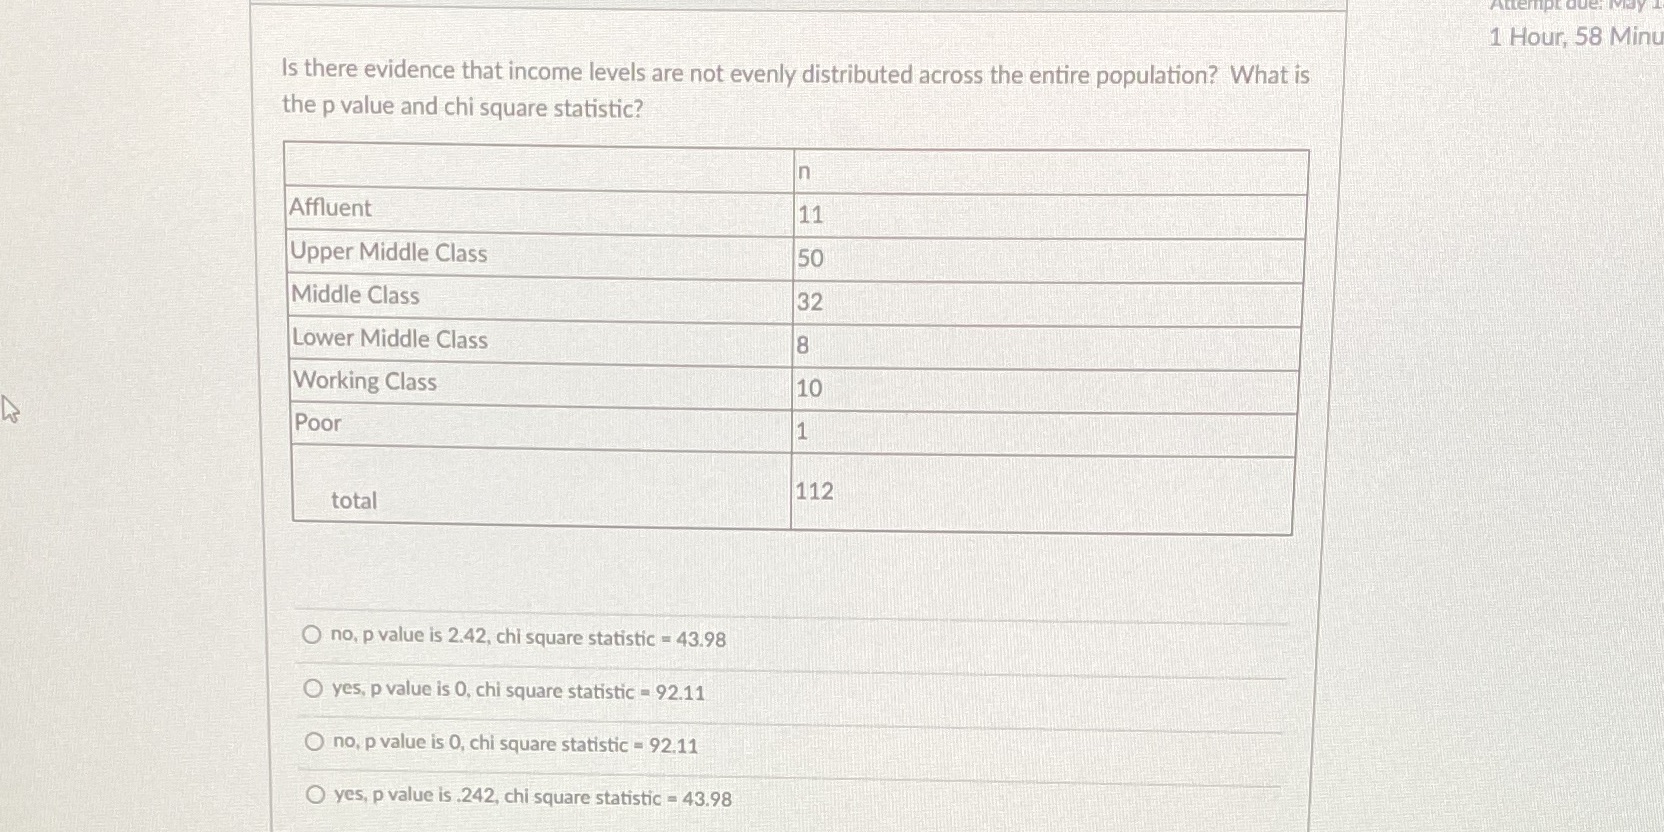
1 Hour, 58 Minu Is there evidence that income levels are not evenly distributed across the entire population? What is the p value and chi
Step by Step Solution
There are 3 Steps involved in it
Step: 1

Get Instant Access to Expert-Tailored Solutions
See step-by-step solutions with expert insights and AI powered tools for academic success
Step: 2

Step: 3
Ace Your Homework with AI
Get the answers you need in no time with our AI-driven, step-by-step assistance
Get Started
Finite Mathematics
Authors: Stefan Waner, Steven Costenoble
6th Edition
1285415604, 9781285415604