

Answered step by step
Verified Expert Solution
Question
1 Approved Answer
1. How to calculate Cost of Equity using CAPM Show calculation and where to take figures. Thank you. MSAN Case 33 California Pinza Kirchen 497
1. How to calculate Cost of Equity using CAPM
Show calculation and where to take figures. Thank you.
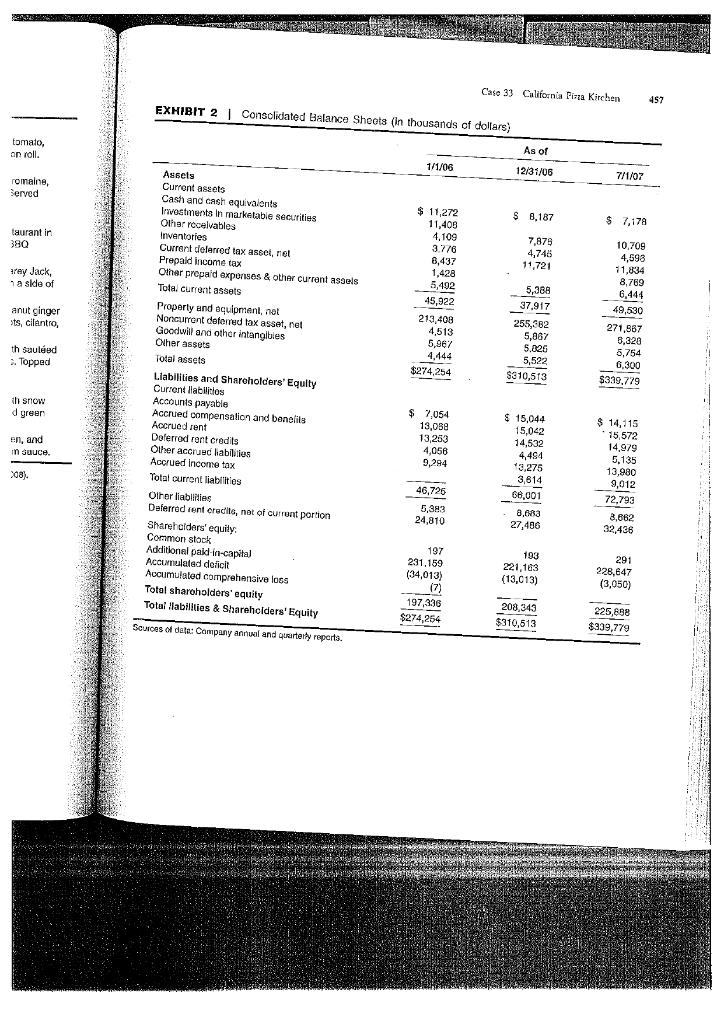
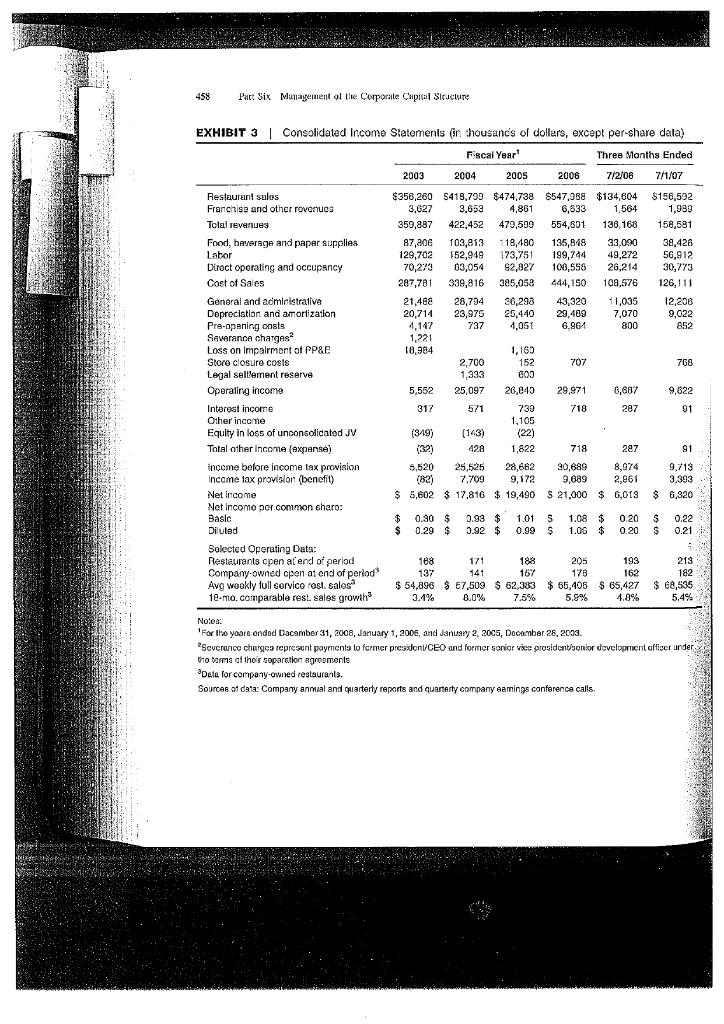
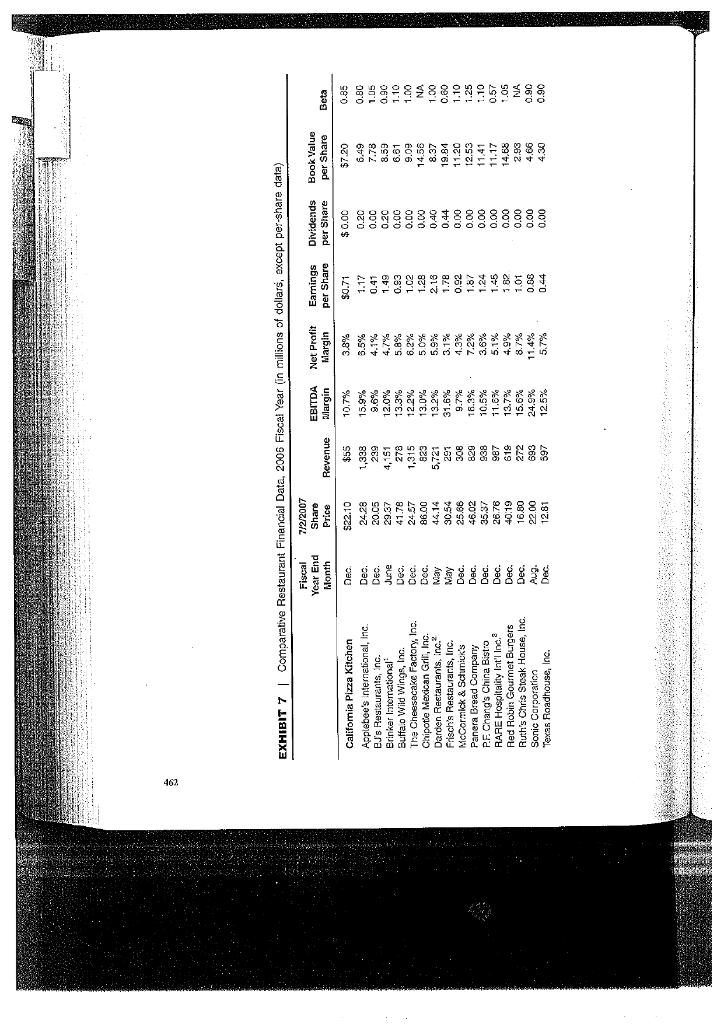
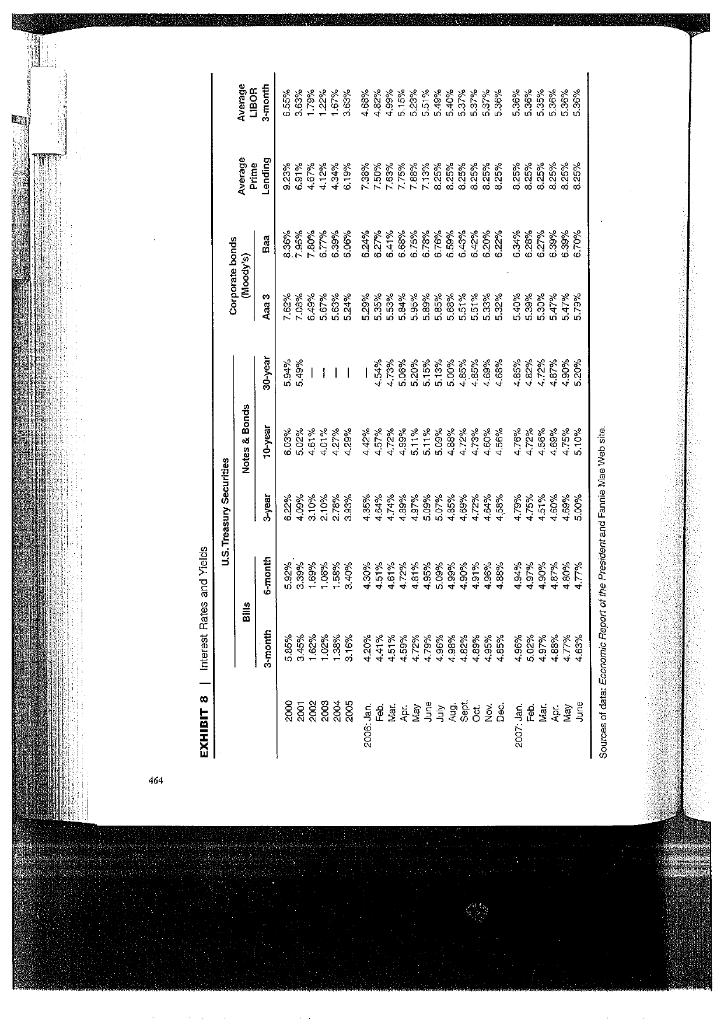
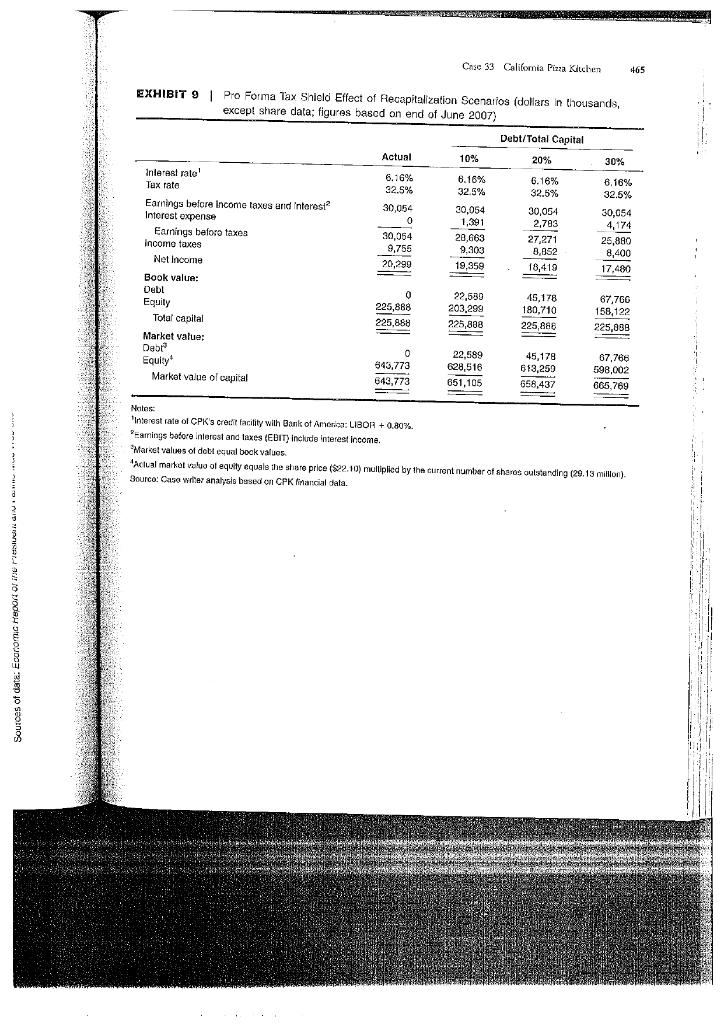
MSAN Case 33 California Pinza Kirchen 497 EXHIBIT 2 Consolidated Balance Shoots (in thousands of dollars) tomato, an roll. As of 1/1/08 12/31/06 7/1/07 romaine, served $ 8.187 $ 7,178 taurant in 380 7,879 4,745 11,721 arey Jack na sklo of $ 11,272 11,400 4,109 3.776 8,437 1,428 5,492 45,922 213,408 4,513 5,967 4.444 $274,254 anut singer ts, cilantro, 5,386 37.917 255,382 5,867 5.826 5,522 $310,513 10,709 4,598 11,834 8,769 6,444 49,530 271,867 8.320 5,754 6.300 $339.779 th Suuleed - Topped Assets Current assets Cash and cash equivalents Investments in marketable securities Othar rouelvables Inventories Current delerred tax assel, ret Prepaid income tax Other prepaid expenses & other current assols Tota. Current assets Property and equipment, not Noncurrent deferred tax asset, net Goodwill and other intangibies Other assets Total assets Liabilities and Shareholders' Equity Current Habichos Accounts payable Accrued compensation and benefits Accrued rent Deferred ront credits Other accrued liabilities Accrued income tax Total current liabilities Other liablilies Deferred sent credits, not of current portion Shareholders' equity Common stock Additional paid-in-capital Accumulated deficit Accumulated comprehensive loss Total shareholders' equity Total Habilities & Shareholders' Equity th snow d green en, and in suuce. $ 7,054 13,038 13,253 4,056 9,294 . 208) ) $ 15,044 15,042 14,532 4,484 3,275 3.814 66,001 8,683 27,486 $ 14,115 15,572 14,979 5,135 13,980 9,012 72,793 8,662 32,436 46,725 5,883 24,810 197 231.159 (34,013) (7) 197,336 $274 254 193 221.183 (13,013) 291 228,647 (3,050) 208,343 $310.513 225,898 420,00 $339,779 SOURCES of dete: Company annual and quarterly reports. 458 Pact Six Management of the Corporate Capio Siructure EXHIBIT 3 | Consolidated Income Statements (in thousands of dollars, except per-share data) Fiscal Year' Three Months Ended 7/1/07 $156,592 1.999 158,581 38,426 56,912 30,773 126,111 12,206 9,022 852 2003 2004 2005 2006 7/2/06 $358,260 S419,799 $474,738 $547,988 $134,604 3,627 3.653 4,861 6,633 1,564 359,887 422,452 479,599 554,801 138,168 87,206 103,813 118,480 135,848 33,090 129,702 152,949 173,751 199,744 49,272 70,273 63,054 42,827 103.558 26,214 287,781 339,816 385,058 444,150 108,576 21,488 28,794 36,298 43,320 11,035 20,714 23,975 25,440 29,409 7,070 4,147 737 4,051 6.964 800 1,221 18,984 1,160 2,700 152 707 1,333 600 5,552 25,097 26,840 29,971 8,607 317 571 730 718 287 1,105 (349) (143) (22) 22) 428 1,822 718 287 5,520 25.525 28,662 30,689 8,974 (82) 7.709 9,172 9,689 2,061 $ 5,602 $ 17,816 $ 19,490 $ 21,000 $ 6,013 763 Restaurant sulos Franchise and other rovenues Tolal revenues Food, beverage and paper supplies Labor Direct operating and occupancy Cost of Salos General and administrative Depreciation and amortization Pre-opening costs Saverance charges Loss on Impairment of PP&C Store closure costs Legal sellement reserve Operating income Interest income Other income Equity in loss of unconsolidated JV Total other income (expanse) income before income tax provision Income tax provision (benefit) Net Income Net Incomo por common sharo: Basic Diluted Selected Operating Data: Restaurants open at end of period Company-owned open at end of period Avg Wookly full service rost sales 18-mo.comparable rest sales growth 9,622 91 91 9,713 3,393 $ 6,320 $ $ 0.30 $ 0.29 $ 0.99 $ 3.92 $ 1.01 S 0.99 $ 1.08 $ 1.06 $ 0.20 0.20 $ $ 0.22 0.21 188 171 188 205 193 137 141 167 178 162 $ 54,896 $ 57,509 $ 62,383 $ 65,405 $ 65,427 3.4% 8.0% 7.5% 5.9% 4.9% 213 182 $ 68,535 5.4% Notes: For the yeare ended Dacamber 31, 2008, January 1, 2005, and January 2, 2005, Decamber 26, 2003. Scvcronice chargco represent payments to former president/CEO and former sonigr vice prosidont/onjor development officer under tho bare at their soparation agreements Dete for company-owned restaurants. Sources of data: Company annual and quarterly reports and quarterly company camings conference calls. EXHIBIT 71 Comparative Restaurant Financial Data, 2006 Fiscal Year (in millions of dollars, except per-share data) Fiscal Year End 7/2/2007 Share Price Net Profit Margin Earnings per Share Dividends per Share Book Value per Share klonth Revenue Beta EBITDA Margin 10.7% 15.9% 9.6% 12.0% 13.3% 12.2% 3.8% 5.5% 4.1% Deo. DEO. June Des. Dec. Dec. May way Califomia Pizza Kitchen Applebee's International, Inc. ed's Restaurants, Inc. Brinker International Buffa.o Wild Wings, Inc. The Cheesecake Factory, Inc. Chipotle Mexican Grill, Inc. Darden Restaurants, inc.? Frisch's Restaurants, Inc. McCormic mick's Panera Bread Company P.F. Chang's China Bistro RARE Hospitality Int'l Ine. Red Robin Gourmet Burgers Ruth's Chris Steak House, Inc. Sonic Corporation Texas Roadhouse, Inc. 13.0% S22.10 2428 20.05 29.37 41.78 2457 86.00 44.14 30.54 25.66 46.02 35.37 26.76 40.19 16.80 22.00 12.81 $55 1,338 239 4,151 278 1,315 823 5,721 292 308 829 938 987 619 272 693 697 13.2% 31.6% 9.7% 16.3% $0.71 1.17 0.41 1.49 0.93 1.C2 1.28 2.13 1.78 0.92 1.87 1.24 1,45 182 1.01 0.88 0.44 5.8% 6.2% 50% 5.9% 3.1% 1.3% 7.2% 3.6% 5.1% 4.9% 8.7% 11,4% 5.7% $ 0.00 0.20 0.00 0.20 0.00 0.00 0.00 0.40 0.44 0.00 0.00 0.00 0.00 0.00 0.00 0.00 0.00 $7.20 6.49 7.73 8.59 6.61 9.09 14.56 8.37 19.84 11.20 12.53 11.41 11.17 14.68 2.93 4.66 4.30 0.85 0.80 1.05 0.90 1.10 1.00 NA 1.00 0.60 1.10 1.25 1.10 0.57 1.05 NA 0.90 0.90 10.5% Dec. Dec. Dec. Dec. Dec. Awa. Dec. 11.8% 13.7% 15.6% 24.9% 12.5% 464 EXHIBIT 8 Interest Rates and Yields U.S. Treasury Securites oms Notes & Bonds 3-month 6-month 3-year 10-year Corporate bonds (Moody's) 30-year Aaa 3 50206 AFC 1.62% 1.04. 1.69% 6.49% 30% 5.24% 160 2.4095 93% 4.29% 5,06% 6.24% 8.27% 5.41% www. 174% 4.57% 15195 1.61% 4.54% 4.73% Ver 4.51% pl. $38555555555335555 59555611 June 1.79% July 96. 8 905 ul.am Ar ce 4970 4.68% 4.17 4.63% Sources of data: Economic Report of the President and Fannie Mae Web site Case 33 Califomia Pizza Klichen +65 EXHIBIT 9 Pro Forma Tax Shield Effect of Flecapitalization Scenarios (dollars in thousands, except share data; figures based on end of June 2007) Debt/Total Capital Actual 10% 20% 30% 6.16% 32.5% 6.16% 32.5% 30,054 0 30,054 9,755 20,299 20,054 1,391 20,663 9.303 19,359 6.16% 32.5% 30,054 2,783 27,271 8,852 18,419 Interest rate! Tux rate Earnings before Income taxes and interest Interest expense Earnings before taxes Income taxes Net Income Book value: Debl Equity Total capital Market value: Dabr Equity Market value of capital 6.16% 32.5% 30,054 4,174 25,880 8,400 17.480 0 225,888 22,589 203,299 225,808 45,178 180,710 225,888 67,760 158,122 225,099 225,868 0 0 543,773 643,773 22.589 628,516 651,105 45,178 613,250 658,437 67,766 598,002 605.769 Notes Interest rate of CPK's credit facility with Bank of America: LIBOH + 0.80%. PEarnings bodoro Interst and laxes (EDIT) Include interest income. Market values of dottual book values Actual market value of equity equals the share price ($22.10) muliplied by the current number of shares outstanding (29.13 million). Source: Caso writer analysis based on CPK financial data. MSAN Case 33 California Pinza Kirchen 497 EXHIBIT 2 Consolidated Balance Shoots (in thousands of dollars) tomato, an roll. As of 1/1/08 12/31/06 7/1/07 romaine, served $ 8.187 $ 7,178 taurant in 380 7,879 4,745 11,721 arey Jack na sklo of $ 11,272 11,400 4,109 3.776 8,437 1,428 5,492 45,922 213,408 4,513 5,967 4.444 $274,254 anut singer ts, cilantro, 5,386 37.917 255,382 5,867 5.826 5,522 $310,513 10,709 4,598 11,834 8,769 6,444 49,530 271,867 8.320 5,754 6.300 $339.779 th Suuleed - Topped Assets Current assets Cash and cash equivalents Investments in marketable securities Othar rouelvables Inventories Current delerred tax assel, ret Prepaid income tax Other prepaid expenses & other current assols Tota. Current assets Property and equipment, not Noncurrent deferred tax asset, net Goodwill and other intangibies Other assets Total assets Liabilities and Shareholders' Equity Current Habichos Accounts payable Accrued compensation and benefits Accrued rent Deferred ront credits Other accrued liabilities Accrued income tax Total current liabilities Other liablilies Deferred sent credits, not of current portion Shareholders' equity Common stock Additional paid-in-capital Accumulated deficit Accumulated comprehensive loss Total shareholders' equity Total Habilities & Shareholders' Equity th snow d green en, and in suuce. $ 7,054 13,038 13,253 4,056 9,294 . 208) ) $ 15,044 15,042 14,532 4,484 3,275 3.814 66,001 8,683 27,486 $ 14,115 15,572 14,979 5,135 13,980 9,012 72,793 8,662 32,436 46,725 5,883 24,810 197 231.159 (34,013) (7) 197,336 $274 254 193 221.183 (13,013) 291 228,647 (3,050) 208,343 $310.513 225,898 420,00 $339,779 SOURCES of dete: Company annual and quarterly reports. 458 Pact Six Management of the Corporate Capio Siructure EXHIBIT 3 | Consolidated Income Statements (in thousands of dollars, except per-share data) Fiscal Year' Three Months Ended 7/1/07 $156,592 1.999 158,581 38,426 56,912 30,773 126,111 12,206 9,022 852 2003 2004 2005 2006 7/2/06 $358,260 S419,799 $474,738 $547,988 $134,604 3,627 3.653 4,861 6,633 1,564 359,887 422,452 479,599 554,801 138,168 87,206 103,813 118,480 135,848 33,090 129,702 152,949 173,751 199,744 49,272 70,273 63,054 42,827 103.558 26,214 287,781 339,816 385,058 444,150 108,576 21,488 28,794 36,298 43,320 11,035 20,714 23,975 25,440 29,409 7,070 4,147 737 4,051 6.964 800 1,221 18,984 1,160 2,700 152 707 1,333 600 5,552 25,097 26,840 29,971 8,607 317 571 730 718 287 1,105 (349) (143) (22) 22) 428 1,822 718 287 5,520 25.525 28,662 30,689 8,974 (82) 7.709 9,172 9,689 2,061 $ 5,602 $ 17,816 $ 19,490 $ 21,000 $ 6,013 763 Restaurant sulos Franchise and other rovenues Tolal revenues Food, beverage and paper supplies Labor Direct operating and occupancy Cost of Salos General and administrative Depreciation and amortization Pre-opening costs Saverance charges Loss on Impairment of PP&C Store closure costs Legal sellement reserve Operating income Interest income Other income Equity in loss of unconsolidated JV Total other income (expanse) income before income tax provision Income tax provision (benefit) Net Income Net Incomo por common sharo: Basic Diluted Selected Operating Data: Restaurants open at end of period Company-owned open at end of period Avg Wookly full service rost sales 18-mo.comparable rest sales growth 9,622 91 91 9,713 3,393 $ 6,320 $ $ 0.30 $ 0.29 $ 0.99 $ 3.92 $ 1.01 S 0.99 $ 1.08 $ 1.06 $ 0.20 0.20 $ $ 0.22 0.21 188 171 188 205 193 137 141 167 178 162 $ 54,896 $ 57,509 $ 62,383 $ 65,405 $ 65,427 3.4% 8.0% 7.5% 5.9% 4.9% 213 182 $ 68,535 5.4% Notes: For the yeare ended Dacamber 31, 2008, January 1, 2005, and January 2, 2005, Decamber 26, 2003. Scvcronice chargco represent payments to former president/CEO and former sonigr vice prosidont/onjor development officer under tho bare at their soparation agreements Dete for company-owned restaurants. Sources of data: Company annual and quarterly reports and quarterly company camings conference calls. EXHIBIT 71 Comparative Restaurant Financial Data, 2006 Fiscal Year (in millions of dollars, except per-share data) Fiscal Year End 7/2/2007 Share Price Net Profit Margin Earnings per Share Dividends per Share Book Value per Share klonth Revenue Beta EBITDA Margin 10.7% 15.9% 9.6% 12.0% 13.3% 12.2% 3.8% 5.5% 4.1% Deo. DEO. June Des. Dec. Dec. May way Califomia Pizza Kitchen Applebee's International, Inc. ed's Restaurants, Inc. Brinker International Buffa.o Wild Wings, Inc. The Cheesecake Factory, Inc. Chipotle Mexican Grill, Inc. Darden Restaurants, inc.? Frisch's Restaurants, Inc. McCormic mick's Panera Bread Company P.F. Chang's China Bistro RARE Hospitality Int'l Ine. Red Robin Gourmet Burgers Ruth's Chris Steak House, Inc. Sonic Corporation Texas Roadhouse, Inc. 13.0% S22.10 2428 20.05 29.37 41.78 2457 86.00 44.14 30.54 25.66 46.02 35.37 26.76 40.19 16.80 22.00 12.81 $55 1,338 239 4,151 278 1,315 823 5,721 292 308 829 938 987 619 272 693 697 13.2% 31.6% 9.7% 16.3% $0.71 1.17 0.41 1.49 0.93 1.C2 1.28 2.13 1.78 0.92 1.87 1.24 1,45 182 1.01 0.88 0.44 5.8% 6.2% 50% 5.9% 3.1% 1.3% 7.2% 3.6% 5.1% 4.9% 8.7% 11,4% 5.7% $ 0.00 0.20 0.00 0.20 0.00 0.00 0.00 0.40 0.44 0.00 0.00 0.00 0.00 0.00 0.00 0.00 0.00 $7.20 6.49 7.73 8.59 6.61 9.09 14.56 8.37 19.84 11.20 12.53 11.41 11.17 14.68 2.93 4.66 4.30 0.85 0.80 1.05 0.90 1.10 1.00 NA 1.00 0.60 1.10 1.25 1.10 0.57 1.05 NA 0.90 0.90 10.5% Dec. Dec. Dec. Dec. Dec. Awa. Dec. 11.8% 13.7% 15.6% 24.9% 12.5% 464 EXHIBIT 8 Interest Rates and Yields U.S. Treasury Securites oms Notes & Bonds 3-month 6-month 3-year 10-year Corporate bonds (Moody's) 30-year Aaa 3 50206 AFC 1.62% 1.04. 1.69% 6.49% 30% 5.24% 160 2.4095 93% 4.29% 5,06% 6.24% 8.27% 5.41% www. 174% 4.57% 15195 1.61% 4.54% 4.73% Ver 4.51% pl. $38555555555335555 59555611 June 1.79% July 96. 8 905 ul.am Ar ce 4970 4.68% 4.17 4.63% Sources of data: Economic Report of the President and Fannie Mae Web site Case 33 Califomia Pizza Klichen +65 EXHIBIT 9 Pro Forma Tax Shield Effect of Flecapitalization Scenarios (dollars in thousands, except share data; figures based on end of June 2007) Debt/Total Capital Actual 10% 20% 30% 6.16% 32.5% 6.16% 32.5% 30,054 0 30,054 9,755 20,299 20,054 1,391 20,663 9.303 19,359 6.16% 32.5% 30,054 2,783 27,271 8,852 18,419 Interest rate! Tux rate Earnings before Income taxes and interest Interest expense Earnings before taxes Income taxes Net Income Book value: Debl Equity Total capital Market value: Dabr Equity Market value of capital 6.16% 32.5% 30,054 4,174 25,880 8,400 17.480 0 225,888 22,589 203,299 225,808 45,178 180,710 225,888 67,760 158,122 225,099 225,868 0 0 543,773 643,773 22.589 628,516 651,105 45,178 613,250 658,437 67,766 598,002 605.769 Notes Interest rate of CPK's credit facility with Bank of America: LIBOH + 0.80%. PEarnings bodoro Interst and laxes (EDIT) Include interest income. Market values of dottual book values Actual market value of equity equals the share price ($22.10) muliplied by the current number of shares outstanding (29.13 million). Source: Caso writer analysis based on CPK financial dataStep by Step Solution
There are 3 Steps involved in it
Step: 1

Get Instant Access to Expert-Tailored Solutions
See step-by-step solutions with expert insights and AI powered tools for academic success
Step: 2

Step: 3
Ace Your Homework with AI
Get the answers you need in no time with our AI-driven, step-by-step assistance
Get Started
Investing For Women Smart Strategies To Start Investing Now With Confidence Low Risk And Minimal Effort
Authors: Mike Hartley ,Hannah Rosenstein
1st Edition
979-8393237202