5. Suppose you want to sell a dozen purple roses for $15. a. How many dozen purple roses should you expect to sell each


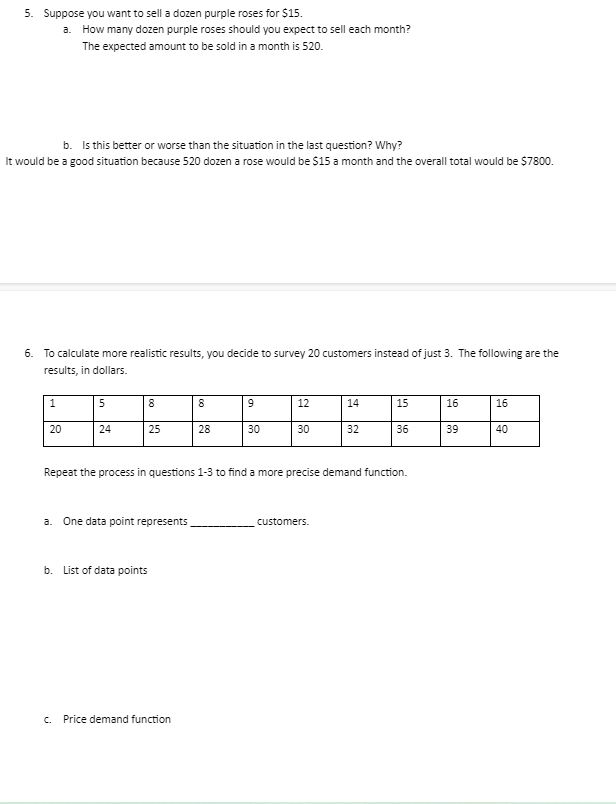
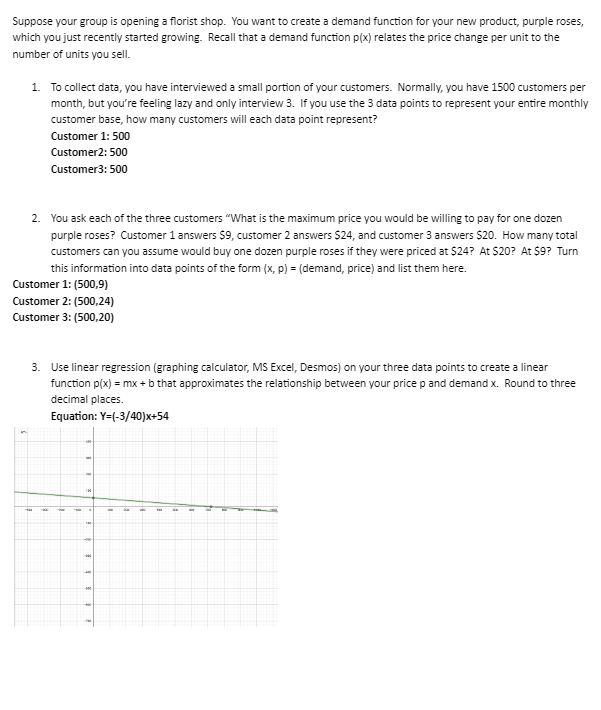
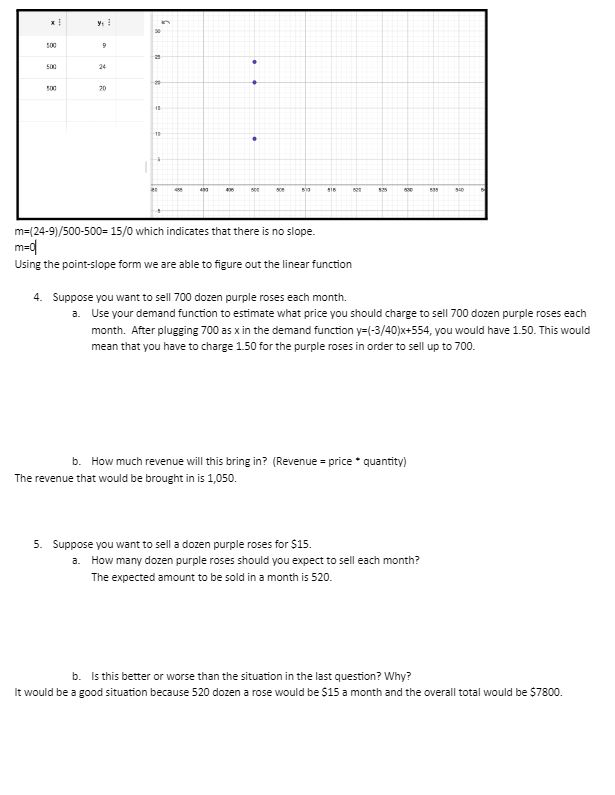
5. Suppose you want to sell a dozen purple roses for $15. a. How many dozen purple roses should you expect to sell each month? The expected amount to be sold in a month is 520. b. Is this better or worse than the situation in the last question? Why? It would be a good situation because 520 dozen a rose would be $15 a month and the overall total would be $7800. 6. To calculate more realistic results, you decide to survey 20 customers instead of just 3. The following are the results, in dollars. 1 5 8 8 co 9 12 14 15 16 16 20 24 25 28 30 30 32 36 39 40 Repeat the process in questions 1-3 to find a more precise demand function. a. One data point represents b. List of data points c. Price demand function customers. Suppose your group is opening a florist shop. You want to create a demand function for your new product, purple roses, which you just recently started growing. Recall that a demand function p(x) relates the price change per unit to the number of units you sell. 1. To collect data, you have interviewed a small portion of your customers. Normally, you have 1500 customers per month, but you're feeling lazy and only interview 3. If you use the 3 data points to represent your entire monthly customer base, how many customers will each data point represent? Customer 1: 500 Customer2: 500 Customer3: 500 2. You ask each of the three customers "What is the maximum price you would be willing to pay for one dozen purple roses? Customer 1 answers $9, customer 2 answers $24, and customer 3 answers $20. How many total customers can you assume would buy one dozen purple roses if they were priced at $24? At $20? At $9? Turn this information into data points of the form (x, p) = (demand, price) and list them here. Customer 1: (500,9) Customer 2: (500,24) Customer 3: (500,20) 3. Use linear regression (graphing calculator, MS Excel, Desmos) on your three data points to create a linear function p(x) = mx + b that approximates the relationship between your price p and demand x. Round to three decimal places. Equation: Y=(-3/40)x+54 500 y! 9 500 24 - 500 20 + 500 820 525 $1 540 m=(24-9)/500-500- 15/0 which indicates that there is no slope. m-q Using the point-slope form we are able to figure out the linear function 4. Suppose you want to sell 700 dozen purple roses each month. a. Use your demand function to estimate what price you should charge to sell 700 dozen purple roses each month. After plugging 700 as x in the demand function y=(-3/40)x+554, you would have 1.50. This would mean that you have to charge 1.50 for the purple roses in order to sell up to 700. b. How much revenue will this bring in? (Revenue = price* quantity) The revenue that would be brought in is 1,050. 5. Suppose you want to sell a dozen purple roses for $15. a. How many dozen purple roses should you expect to sell each month? The expected amount to be sold in a month is 520. b. Is this better or worse than the situation in the last question? Why? It would be a good situation because 520 dozen a rose would be $15 a month and the overall total would be $7800.
Step by Step Solution
There are 3 Steps involved in it
Step: 1
Solutions Step 1 Price control is a government mandated maximum or minimum price of specific good or services Step 2 Option A If roses are currently s...
See step-by-step solutions with expert insights and AI powered tools for academic success
Step: 2

Step: 3

Ace Your Homework with AI
Get the answers you need in no time with our AI-driven, step-by-step assistance
Get Started


