

Answered step by step
Verified Expert Solution
Question
1 Approved Answer
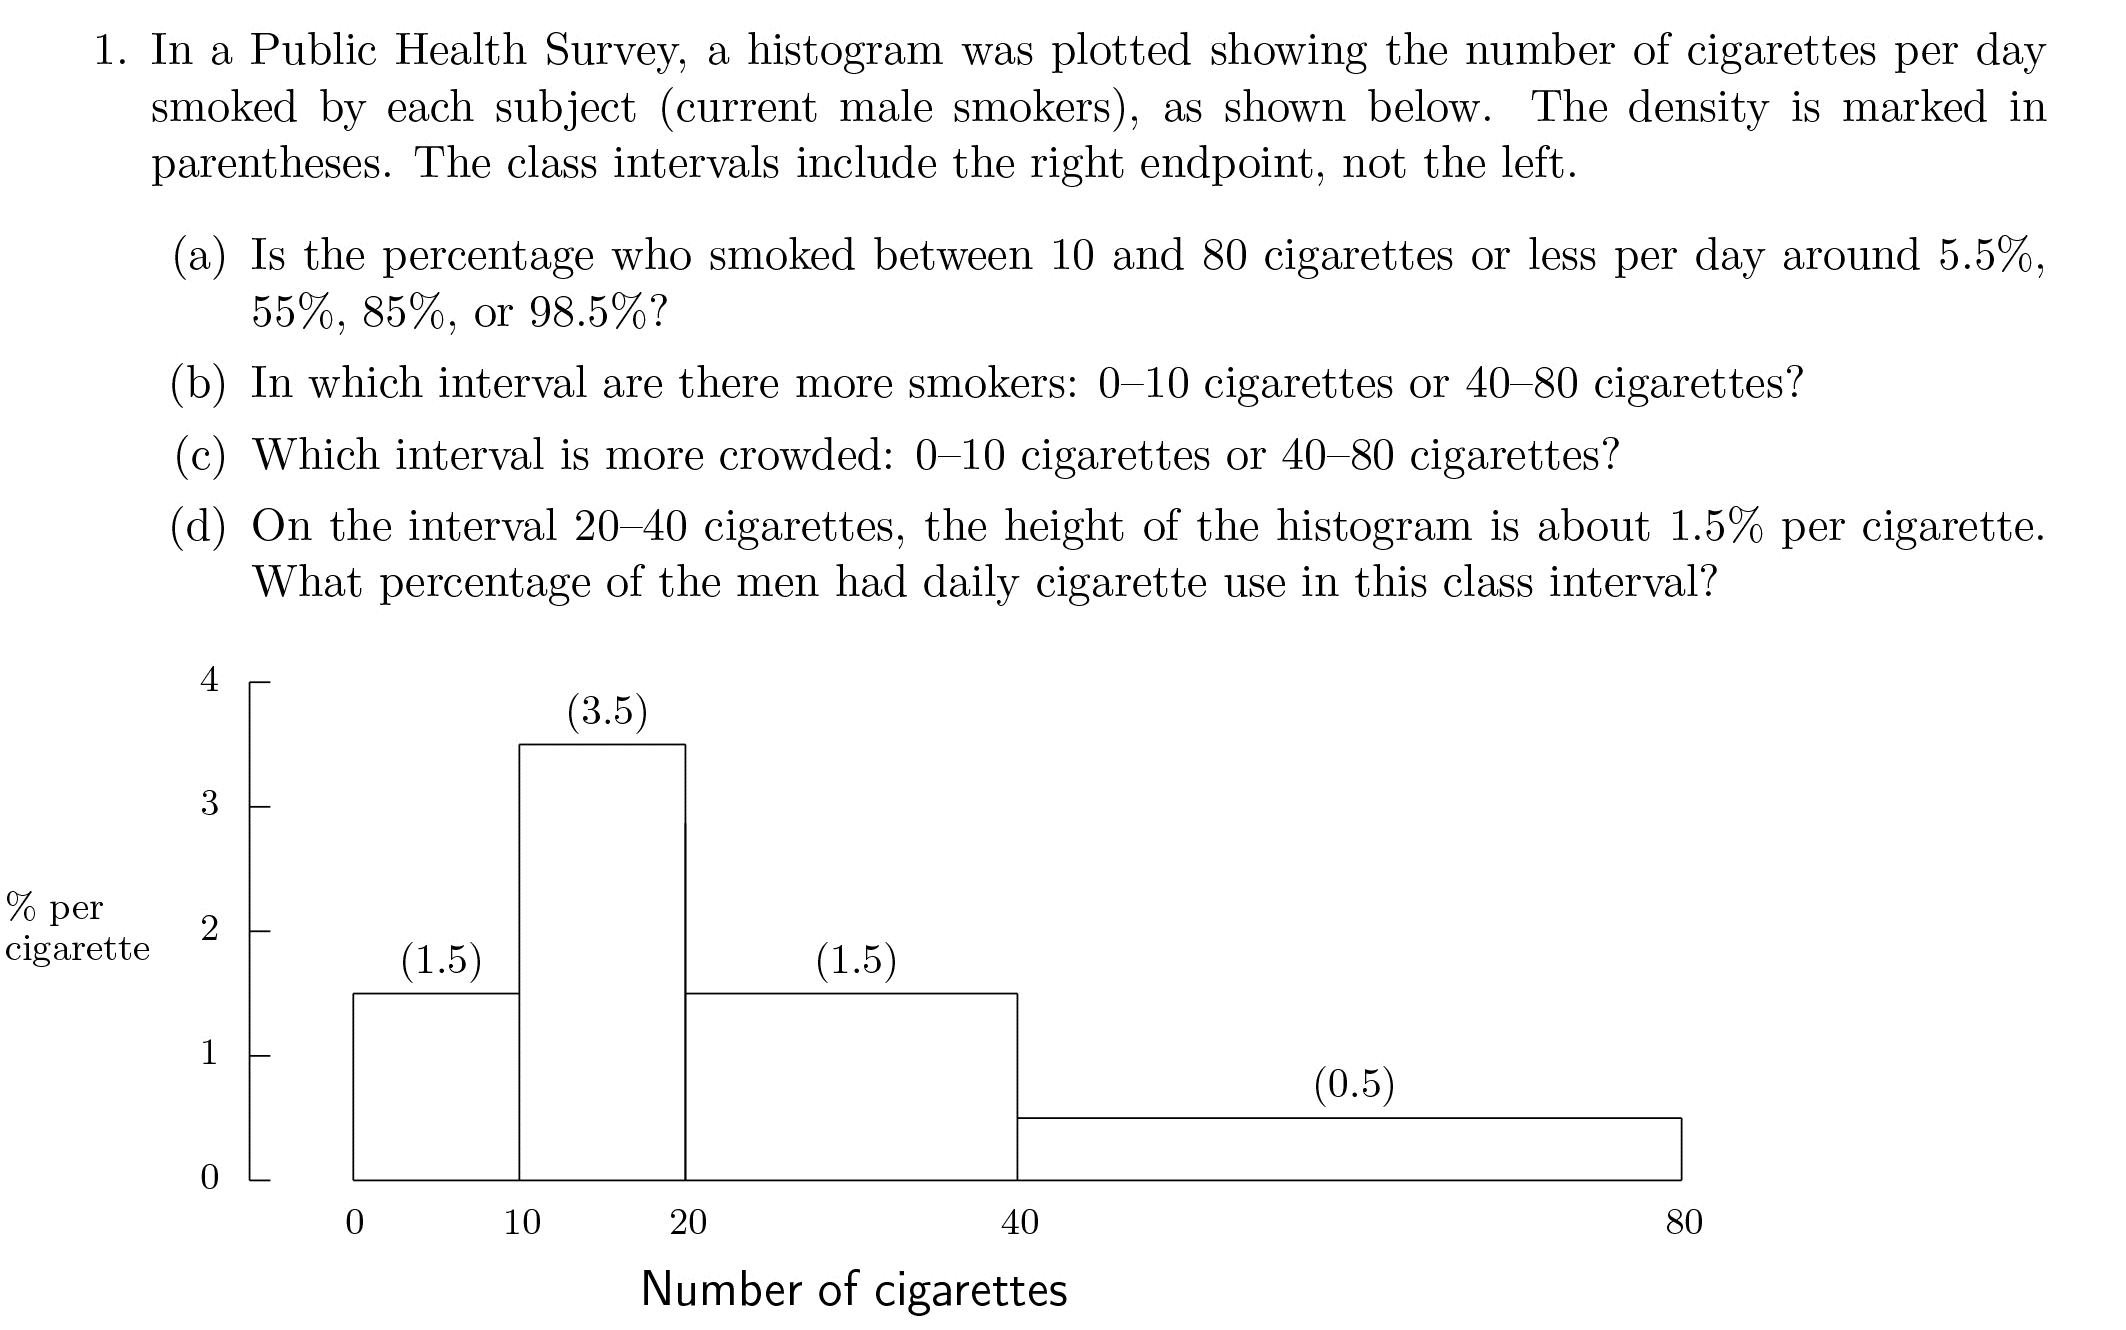
1. In a Public Health Survey, a histogram was plotted showing the number of cigarettes per day smoked by each subject (current male smokers), as

Step by Step Solution
There are 3 Steps involved in it
Step: 1

Get Instant Access to Expert-Tailored Solutions
See step-by-step solutions with expert insights and AI powered tools for academic success
Step: 2

Step: 3
Ace Your Homework with AI
Get the answers you need in no time with our AI-driven, step-by-step assistance
Get Started
Geometry, Structure And Randomness In Combinatorics
Authors: Ji?í Matousek, Jaroslav Nešet?il, Marco Pellegrini
1st Edition
887642525X, 9788876425257