Answered step by step
Verified Expert Solution
Question
1 Approved Answer
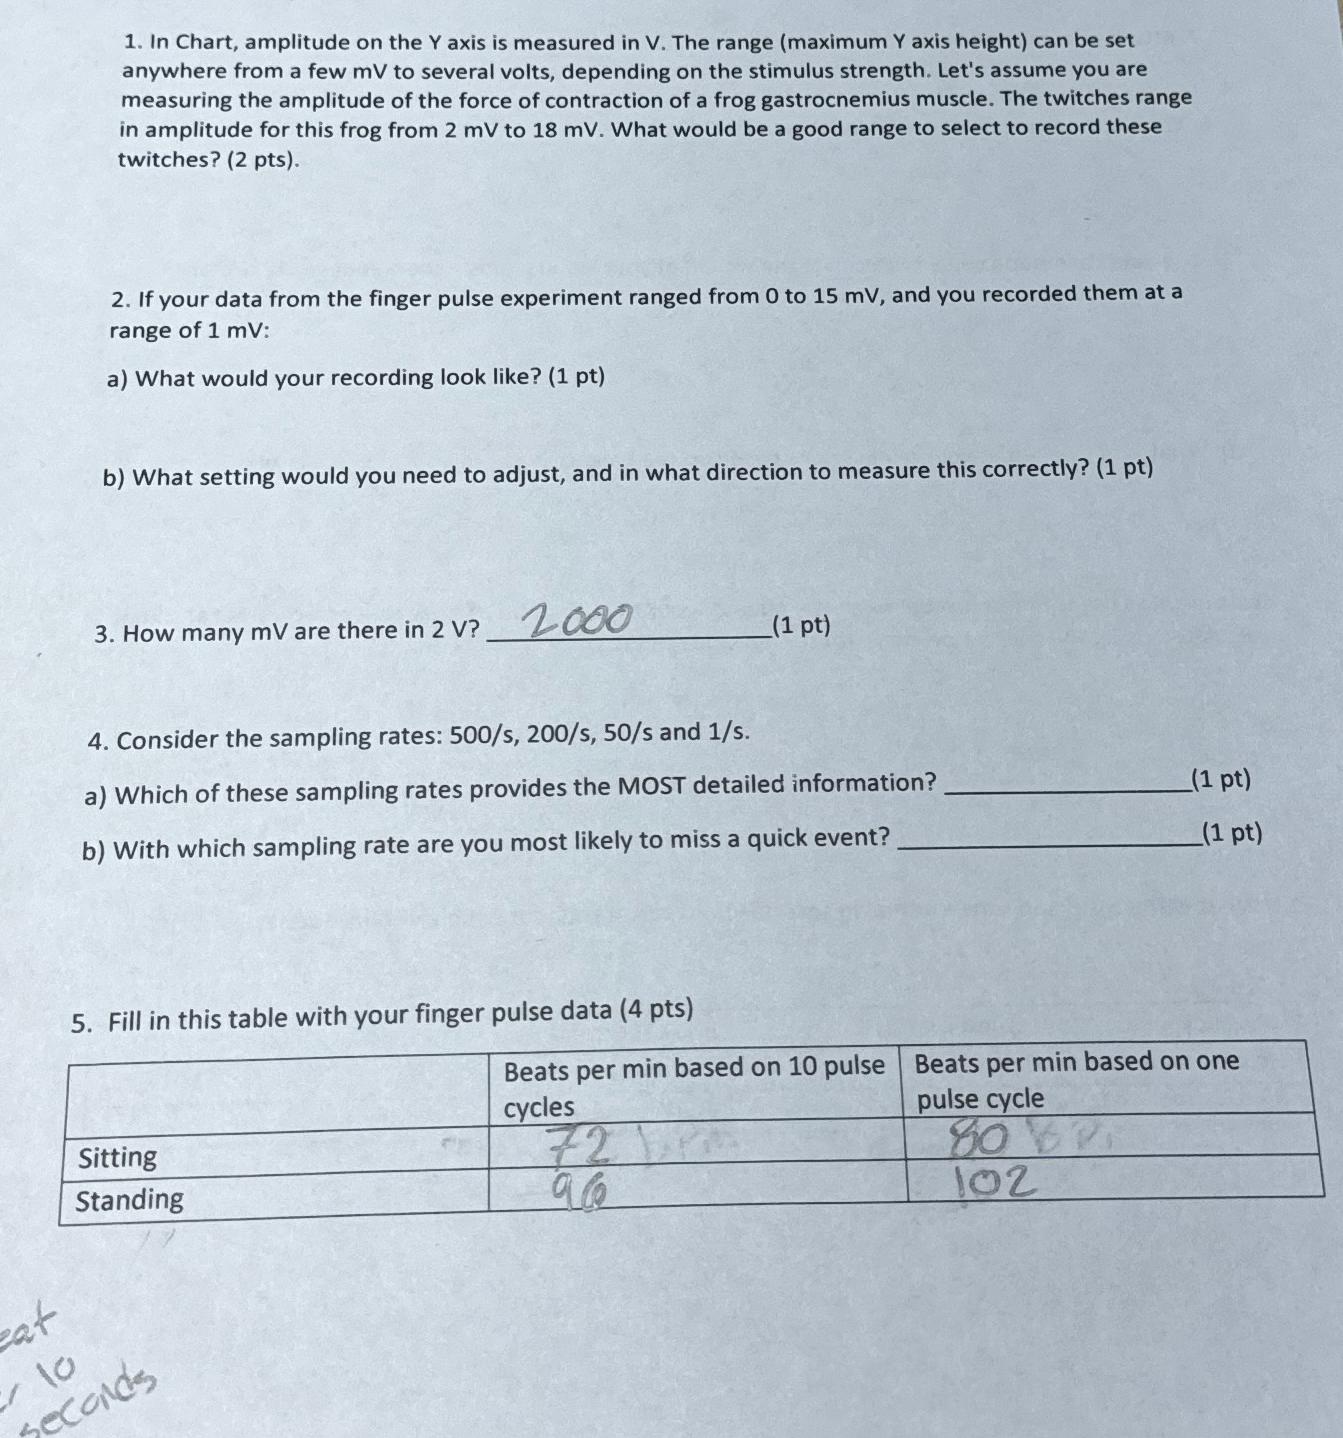
1. In Chart, amplitude on the Y axis is measured in V. The range (maximum Y axis height) can be set anywhere from a
1. In Chart, amplitude on the Y axis is measured in V. The range (maximum Y axis height) can be set anywhere from a few mV to several volts, depending on the stimulus strength. Let's assume you are measuring the amplitude of the force of contraction of a frog gastrocnemius muscle. The twitches range in amplitude for this frog from 2 mV to 18 mV. What would be a good range to select to record these twitches? (2 pts). 2. If your data from the finger pulse experiment ranged from 0 to 15 mV, and you recorded them at a range of 1 mV: a) What would your recording look like? (1 pt) b) What setting would you need to adjust, and in what direction to measure this correctly? (1 pt) 3. How many mV are there in 2 V? 2000 (1 pt) 4. Consider the sampling rates: 500/s, 200/s, 50/s and 1/s. a) Which of these sampling rates provides the MOST detailed information? b) With which sampling rate are you most likely to miss a quick event? (1 pt) (1 pt) 5. Fill in this table with your finger pulse data (4 pts) at Sitting Standing lo seconds Beats per min based on 10 pulse Beats per min based on one pulse cycle cycles 72 96 80 BP 102
Step by Step Solution
There are 3 Steps involved in it
Step: 1
1 Frog Muscle Twitch Measurement Range Given a twitch range of 2 mV to 18 mV a good range to select for recording would be 5 mV to 20 mV Rationale This range comfortably accommodates the entire range ...
Get Instant Access to Expert-Tailored Solutions
See step-by-step solutions with expert insights and AI powered tools for academic success
Step: 2

Step: 3

Ace Your Homework with AI
Get the answers you need in no time with our AI-driven, step-by-step assistance
Get Started


