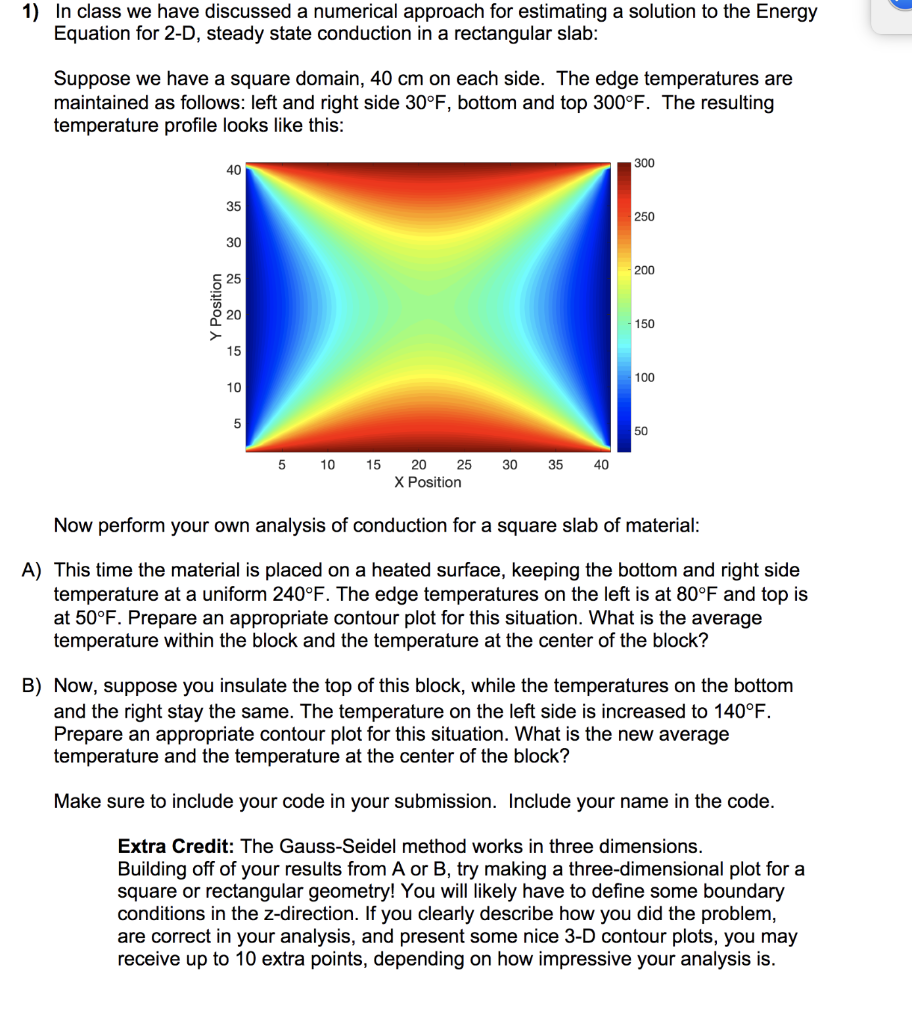
1) In class we have discussed a numerical approach for estimating a solution to the Energy Equation for 2-D, steady state conduction in a rectangular slab: Suppose we have a square domain, 40 cm on each side. The edge temperatures are maintained as follows: left and right side 30F, bottom and top 300F. The resulting temperature profile looks like this: Y Position 5 10 15 20 25 X Position 30 35 40 Now perform your own analysis of conduction for a square slab of material: A) This time the material is placed on a heated surface, keeping the bottom and right side temperature at a uniform 240F. The edge temperatures on the left is at 80F and top is at 50F. Prepare an appropriate contour plot for this situation. What is the average temperature within the block and the temperature at the center of the block? B) Now, suppose you insulate the top of this block, while the temperatures on the bottom and the right stay the same. The temperature on the left side is increased to 140F. Prepare an appropriate contour plot for this situation. What is the new average temperature and the temperature at the center of the block? Make sure to include your code in your submission. Include your name in the code. Extra Credit: The Gauss-Seidel method works in three dimensions. Building off of your results from A or B, try making a three-dimensional plot for a square or rectangular geometry! You will likely have to define some boundary conditions in the z-direction. If you clearly describe how you did the problem, are correct in your analysis, and present some nice 3-D contour plots, you may receive up to 10 extra points, depending on how impressive your analysis is. 1) In class we have discussed a numerical approach for estimating a solution to the Energy Equation for 2-D, steady state conduction in a rectangular slab: Suppose we have a square domain, 40 cm on each side. The edge temperatures are maintained as follows: left and right side 30F, bottom and top 300F. The resulting temperature profile looks like this: Y Position 5 10 15 20 25 X Position 30 35 40 Now perform your own analysis of conduction for a square slab of material: A) This time the material is placed on a heated surface, keeping the bottom and right side temperature at a uniform 240F. The edge temperatures on the left is at 80F and top is at 50F. Prepare an appropriate contour plot for this situation. What is the average temperature within the block and the temperature at the center of the block? B) Now, suppose you insulate the top of this block, while the temperatures on the bottom and the right stay the same. The temperature on the left side is increased to 140F. Prepare an appropriate contour plot for this situation. What is the new average temperature and the temperature at the center of the block? Make sure to include your code in your submission. Include your name in the code. Extra Credit: The Gauss-Seidel method works in three dimensions. Building off of your results from A or B, try making a three-dimensional plot for a square or rectangular geometry! You will likely have to define some boundary conditions in the z-direction. If you clearly describe how you did the problem, are correct in your analysis, and present some nice 3-D contour plots, you may receive up to 10 extra points, depending on how impressive your analysis is