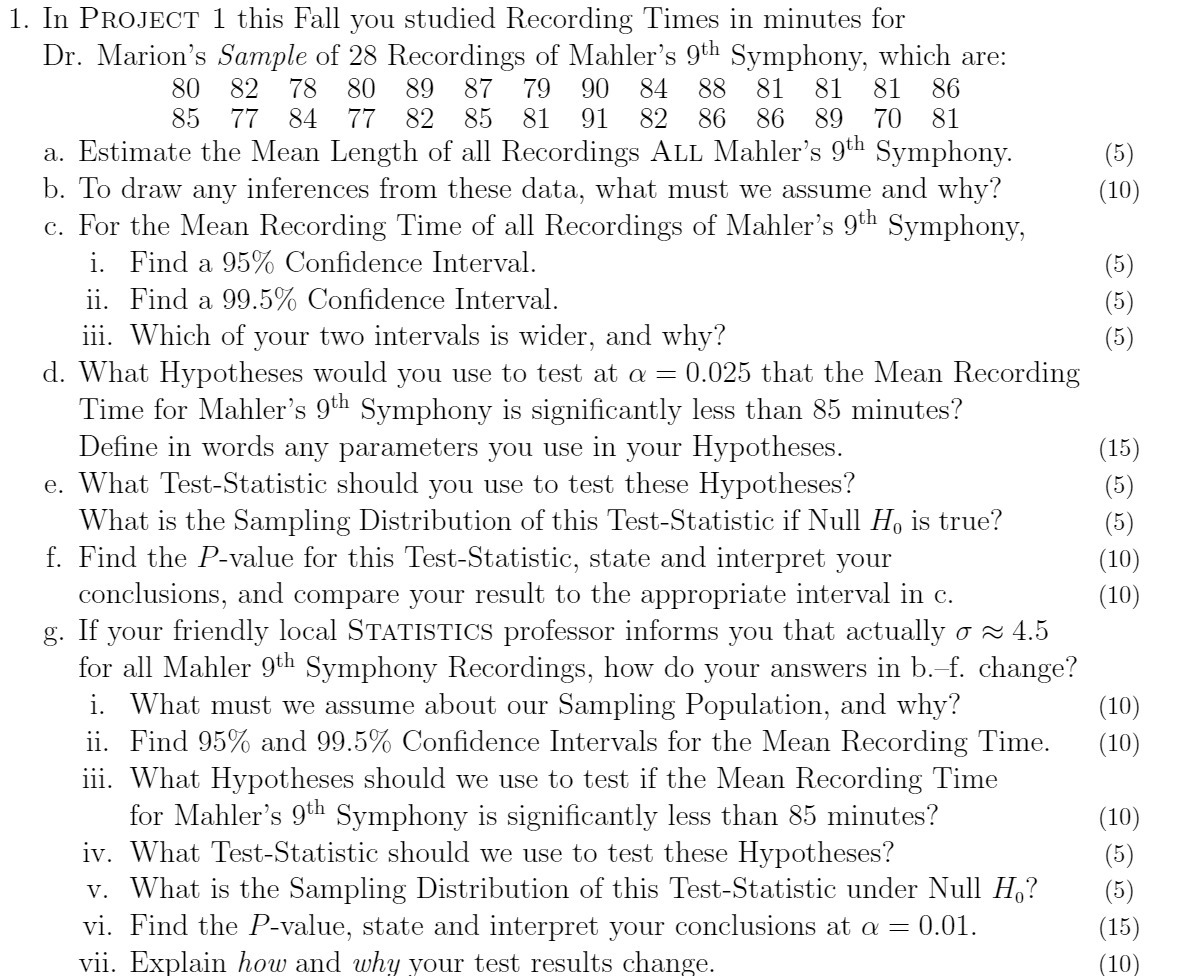
1. In PROJECT 1 this Fall you studied Recording Times in minutes for Dr. Marion's Sample of 28 Recordings of Mahler's 9th Symphony, which are: C\" 80 82 78 80 89 87 79 90 84 88 81 81 81 86 85 77 84 77 82 85 81 91 82 86 86 89 70 81 Estimate the Mean Length of all Recordings ALL Mahler's 9th Symphony. i. ii. iii. . What Hypotheses would you use to test at o: : 0.025 that the Mean Recording . To draw any inferences from these data, what must we assume and why? . For the Mean Recording Time of all Recordings of Mahler's 9th Symphony, Find a 95% Condence Interval. Find a 99.5% Condence Interval. Which of your two intervals is wider, and why? Time for Mahler's 9th Symphony is signicantly less than 85 minutes? Dene in words any parameters you use in your Hypotheses. . What TestStatistic should you use to test these Hypotheses? What is the Sampling Distribution of this Test-Statistic if Null HE. is true? Find the Pvalue for this TestStatistic, state and interpret your conclusions, and compare your result to the appropriate interval in c. for all Mahler 9th Symphony Recordings, how do your answers in b. f. change? i. ii. iii. iv. vi. vii. . If your friendly local STATISTICS professor informs you that actually a N 45 What must we assume about our Sampling Population, and why? Find 95 % and 99.5 % Condence Intervals for the Mean Recording Time. What Hypotheses should we use to test if the Mean Recording Time for Mahler's 9th Symphony is signicantly less than 85 minutes? What TestStatistic should we use to test these Hypotheses? What is the Sampling Distribution of this Test-Statistic under Null Ha? Find the Pvalue, state and interpret your conclusions at o: : 0.01. Explain how and why your test results change. (5) (10) r'x r'x r'x CT CT C?! V V V (10) (10) (10) (5) (5) (15)