Answered step by step
Verified Expert Solution
Link Copied!

Question

1 Approved Answer

1) In regression analysis, the model in the form y = 0 + 1x + is called the a) regression model. b) correlation model.c) regression

1) In regression analysis, the model in the form y = 0 + 1x + is called the

a) regression model. b) correlation model.c) regression equation. d) estimated regression equation.

2)Regression analysis is a statistical procedure for developing a mathematical equation that describes how

a) one dependent and one or more independent variables are related.one dependent,

b) one independent, and several error variables are related.

c) one independent and one or more dependent variables are related.

d) several independent and several dependent variables are related.

3)In regression analysis, the variable that is being predicted is the

a) intercept variable. b) error variable.c) dependent variable. d) independent variable.
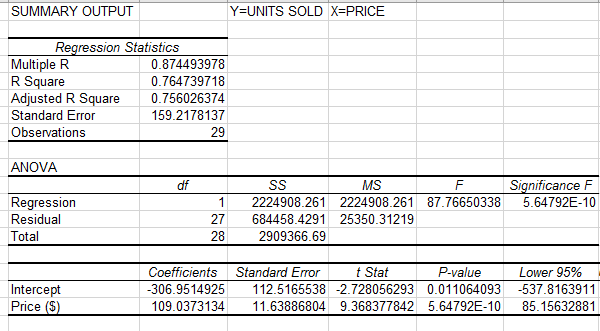
image text in transcribedimage text in transcribedimage text in transcribed
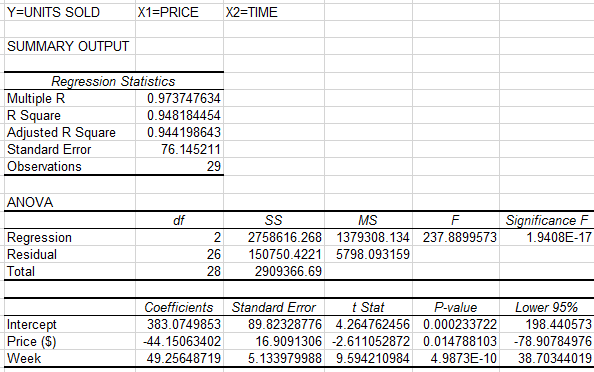
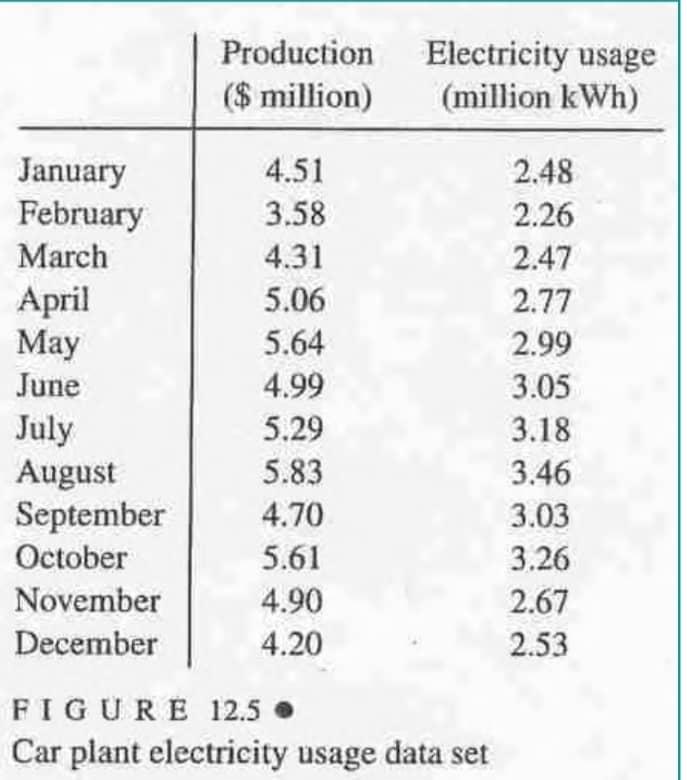
SUMMARY OUTPUT Y=UNITS SOLD X=PRICE Regression Statistics Multiple R 0.874493978 R Square 0.764739718 Adjusted R Square 0.756026374 Standard Error 159.2178137 Observations 29 ANOVA SS MS F Significance F Regression 1 2224908.261 2224908.261 87.76650338 5.64792E-10 Residual 27 684458.4291 25350.31219 Total 28 2909366.69 Coefficients Standard Error t Stat P-value Lower 95% Intercept -306.9514925 112 5165538 -2.728056293 0.011064093 -537.8163911 Price ($) 109.0373134 11 63886804 9.368377842 5.64792E-10 85.15632881Y=UNITS SOLD X1=PRICE X2=TIME SUMMARY OUTPUT Regression Statistics Multiple R 0.973747634 R Square 0.948184454 Adjusted R Square 0.944198643 Standard Error 76.145211 Observations 29 ANOVA cdf SS MS F Significance F Regression 2 2758616.268 1379308.134 237.8899573 1.9408E-17 Residual 26 150750.4221 5798.093159 Total 28 2909366.69 Coefficients Standard Error t Stat P-value Lower 95% Intercept 383.0749853 89 82328776 4.264762456 0.000233722 198.440573 Price ($) -44. 15063402 16.9091306 -2 611052872 0.014788103 -78.90784976 Week 49.25648719 5.133979988 9.594210984 4.9873E-10 38.70344019Production Electricity usage - ' ' (million kWh) F I G U R E 12.5 0 Car plant electricity usage data set

Step by Step Solution

There are 3 Steps involved in it

Step: 1

blur-text-image

Get Instant Access to Expert-Tailored Solutions

See step-by-step solutions with expert insights and AI powered tools for academic success

Step: 2

blur-text-image

Step: 3

blur-text-image

Ace Your Homework with AI

Get the answers you need in no time with our AI-driven, step-by-step assistance

Get Started

Recommended Textbook for

Precalculus Enhanced With Graphing Utilities (Subscription)

Authors: Michael, Michael Sullivan III, Michael III Sullivan, III Sullivan

6th Edition

0321849108, 9780321849106

More Books

Students also viewed these Mathematics questions