Question
1. In the Pareto Chart you can identify in the whole set of tools, which among the causes is the least significant? (Identify the Letter
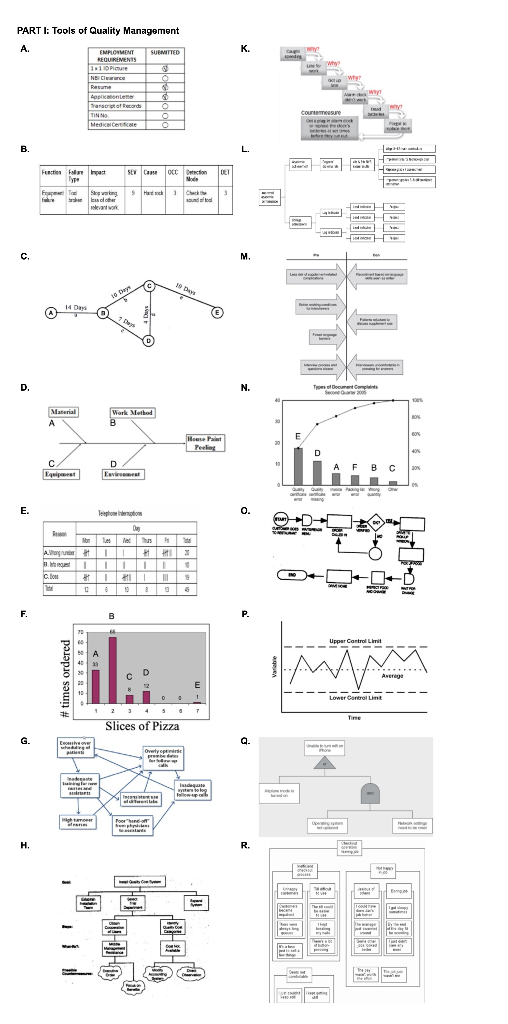
1. In the Pareto Chart you can identify in the whole set of tools, which among the causes is the least significant? (Identify the Letter within the diagram)
2. One of the diagrams in the set is the Failure Mode and Effect Analysis (FMEA). In the given FMEA table, what is the resulting Risk Priority Number (RPN)? Enter your numerical answer.
3. This tool is used by repeatedly asking the question five times as a good rule of thumb. In this way, you can peel away the layers of symptoms that can lead you to the evil at the bottom.
4. Discovers key ideas by relationships represented by the cells in matrix. Symbols are used to factor-in relationships.
5. It maps out the paths and tasks that need to be accomplished to complete a specific project or to reach a specified goal. Also known as Systematic diagrams or Dendrograms.
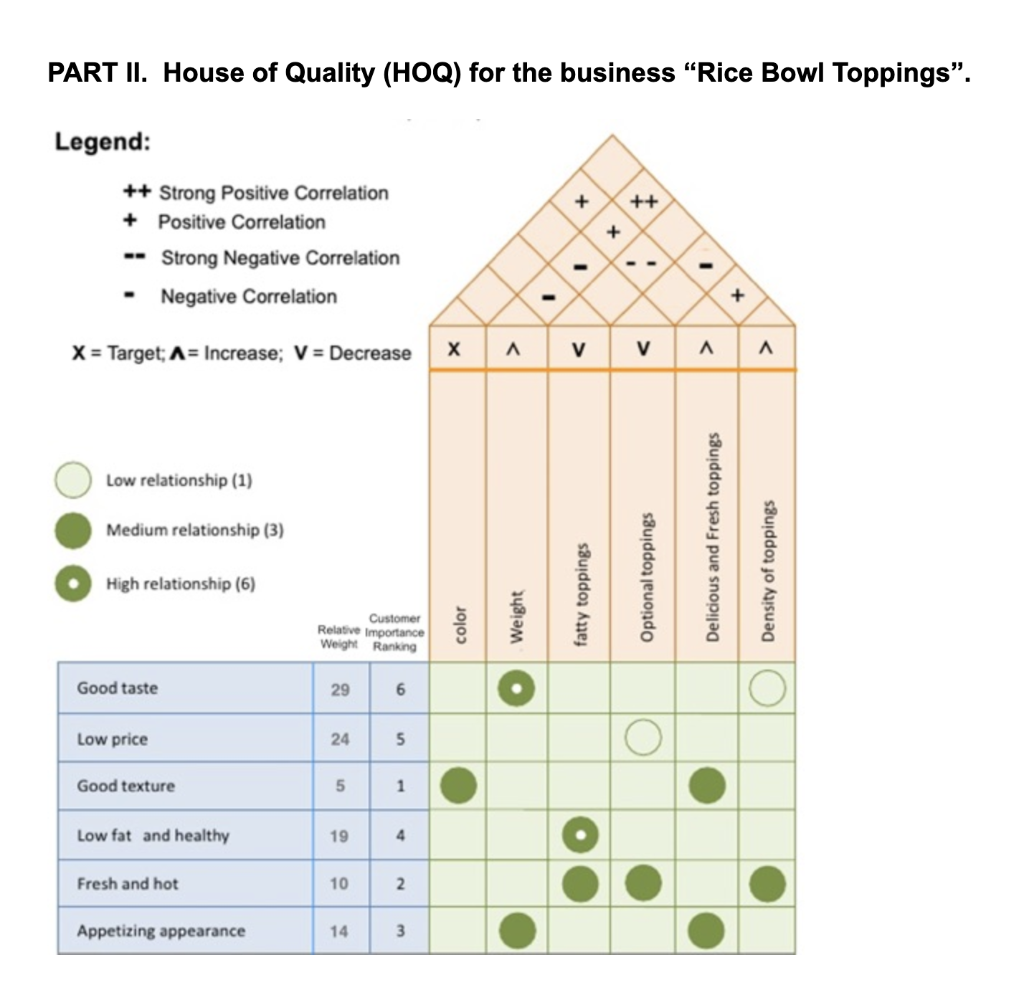
PART II. House of Quality (HOQ) for the business "Rice Bowl Toppings". Legend: ++ Strong Positive Correlation + Positive Correlation -. Strong Negative Correlation - Negative Correlation X= Target A= Increase; V= Decrease PART II. House of Quality (HOQ) for the business "Rice Bowl Toppings". Legend: ++ Strong Positive Correlation + Positive Correlation -. Strong Negative Correlation - Negative Correlation X= Target A= Increase; V= DecreaseStep by Step Solution
There are 3 Steps involved in it
Step: 1

Get Instant Access to Expert-Tailored Solutions
See step-by-step solutions with expert insights and AI powered tools for academic success
Step: 2

Step: 3
Ace Your Homework with AI
Get the answers you need in no time with our AI-driven, step-by-step assistance
Get Started