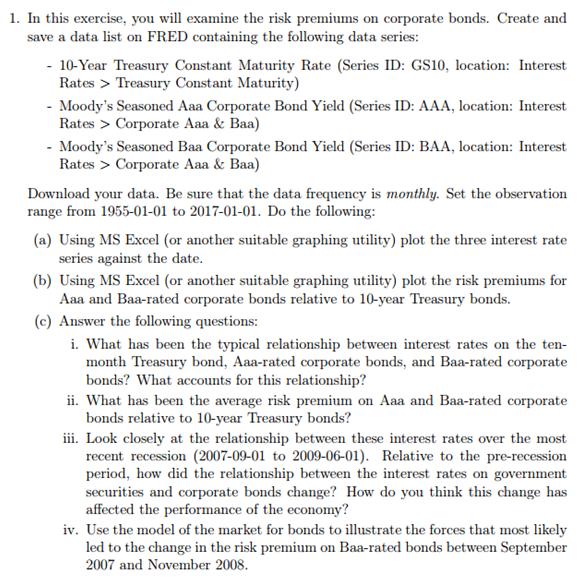
Question: 1. In this exercise, you will examine the risk premiums on corporate bonds. Create and save a data list on FRED containing the following

1. In this exercise, you will examine the risk premiums on corporate bonds. Create and save a data list on FRED containing the following data series: - 10-Year Treasury Constant Maturity Rate (Series ID: GS10, location: Interest Rates > Treasury Constant Maturity) - Moody's Seasoned Aaa Corporate Bond Yield (Series ID: AAA, location: Interest Rates > Corporate Aaa & Baa) - Moody's Seasoned Baa Corporate Bond Yield (Series ID: BAA, location: Interest Rates > Corporate Aaa & Baa) Download your data. Be sure that the data frequency is monthly. Set the observation range from 1955-01-01 to 2017-01-01. Do the following: (a) Using MS Excel (or another suitable graphing utility) plot the three interest rate series against the date. (b) Using MS Excel (or another suitable graphing utility) plot the risk premiums for Aaa and Baa-rated corporate bonds relative to 10-year Treasury bonds. (c) Answer the following questions: i. What has been the typical relationship between interest rates on the ten- month Treasury bond, Aaa-rated corporate bonds, and Baa-rated corporate bonds? What accounts for this relationship? ii. What has been the average risk premium on Aaa and Baa-rated corporate bonds relative to 10-year Treasury bonds? iii. Look closely at the relationship between these interest rates over the most recent recession (2007-09-01 to 2009-06-01). Relative to the pre-recession period, how did the relationship between the interest rates on government securities and corporate bonds change? How do you think this change has affected the performance of the economy? iv. Use the model of the market for bonds to illustrate the forces that most likely led to the change in the risk premium on Baa-rated bonds between September 2007 and November 2008.
Step by Step Solution
There are 3 Steps involved in it
Answer The data was downloaded from FRED and 3 graphs were prepared using MSExcel Insert Graph feature and for better understanding line graph choice ... View full answer

Get step-by-step solutions from verified subject matter experts


