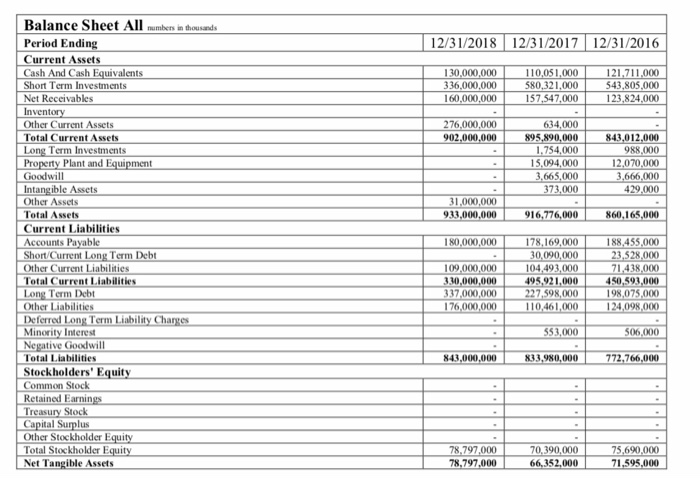
1) in Which year did the Golden Sachs have better liquidity position ? A. 2018, B. 2017, C. 2016, D. Data provided is not enough
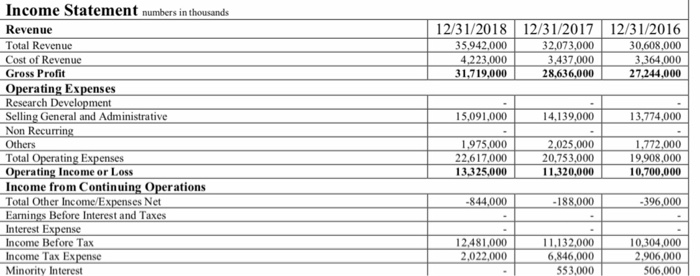
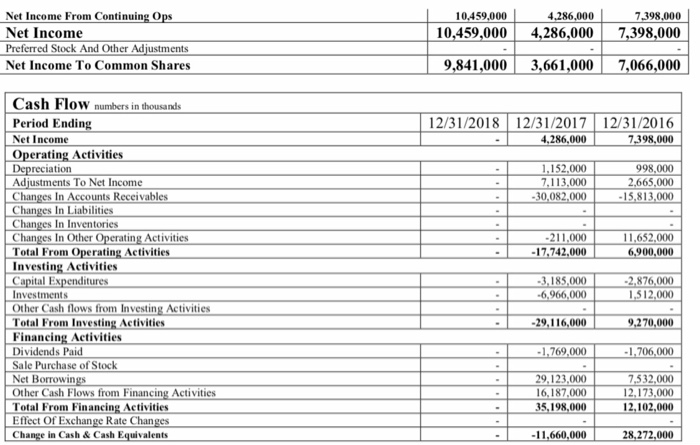
2)In what year did Goldman have better profitability ? 2018, 2017, 2016, Data not provided

Balance SheetAll in hosds Period Endin Current Assets Cash And Cash Equivalents Short Term Investments Net Receivables Inventor Other Current Assets Total Current Assets 12/31/2018 12/31/2017 12/31/2016 130,000,000 336,000,000 160,000,000 10,05 1,000 580.321,000 157,547,000 121,711,000 543,805,000 123,824,000 276,000,000 902.0 634,000 895,890,000 1.754,000 15,094,000 3.665,000 73,000 843,012 Term Investment:s ty Plant and Equi 988,000 12,070,000 666,000 429.000 Goodwill Intangible Assets Other Assets Total Assets Current Liabilities Accounts Short/Current Long Term Debt Other Current Liabilities Tetal Current Liabilitie 1,000,000 916,776,000 860,165, ble 178,169,000 30,090,000 109,000,000104,493,000 188.455.000 23,528,000 71.438,000 95,921,000 450,593,000 198,075,000 4,098,000 80,000,000 30,000,000 37,000,000 176,000,000 Term Debt 27,598,000 10,461,000 Other Liabilities Deferred Long Term Minority Interest Negative Goodwill Total Liabilities Char 553,000 06,000 843,0 833,980,000 772,766,0 Stockholders' Equity Common Stock Retained Earnin Treasury Stock Capital Surplus Other Stockholder E Total Stockholder E Net Tangible Assets 90,000 352,000 78,797,000 75,690,000 71,595 Income Statement numbers in thousands 12/31/2018 12/31/201712/31/2016 30,608,000 3,364,000 Revenue Total Revenue Cost of Revenue Gross Profit Operating Expenses Research Development Selling General and Administrative Non Recurr Others Total Operating Ex Operating Income or Loss Income from Continuing Operations Total Other Income Ex 35,942,000 4,223,000 31.719,000 32,073,000 3.437,000 28,636,000 27 15,091,000 4,139,000 13,774,000 1,975,000 22,617,000 3.325,000 2,025,000 20,753,000 1320,000 1,772,000 19,908,000 10,700,000 s Net 844,000 188,000 396,000 Bef Interest and Taxes Interest Ex Income Before Tax Income Tax Ex 12,481,000 2,022,000 11,132,000 6,846,000 553,000 10,304,000 2,906,000 506,000 Minority Interest Net Income From Continuing O Net Income Preferred Stock And Other Ad Net Income To Common Shares 10,459,000 4,286,000 10,459,000 4,286,000 7,398,000 9,841,000 3,661,0007,066,000 Cash Flow numbers in thousands Period Ending Net Income Operating Activities 12/31/2018 12/31/20172/31/2016 7.398,000 4,286,000 1,152,000 7,113,000 30,082,000 998,000 2.665,000 5,813,000 reciationn Adjustments To Net Income Changes In Accounts Receivables Changes In Liabilities Changes In Inventories Changes In Other Total From Operating Activities Investing Activities 211,000 7.742,000 11,652,000 900,000 ting Activities 3.185,000 966,000 tures 876,000 512.000 Investments Other Cash flows from Investing Activities Total From Investing Activities Financing Activities Dividends Paid Sale Purchase of Stock Net Borrowin Other Cash Flows from Financing Activities Total From Financing Activities Effect Of Exchange Rate Chan Change in Cash& Cash Equivalents 29,116,000 9,270,000 1,769,000 1,706,000 29,123,000 16,187,000 35,198,000 7532,000 12,173,000 12,102,000 11,660,000 8,272,000


