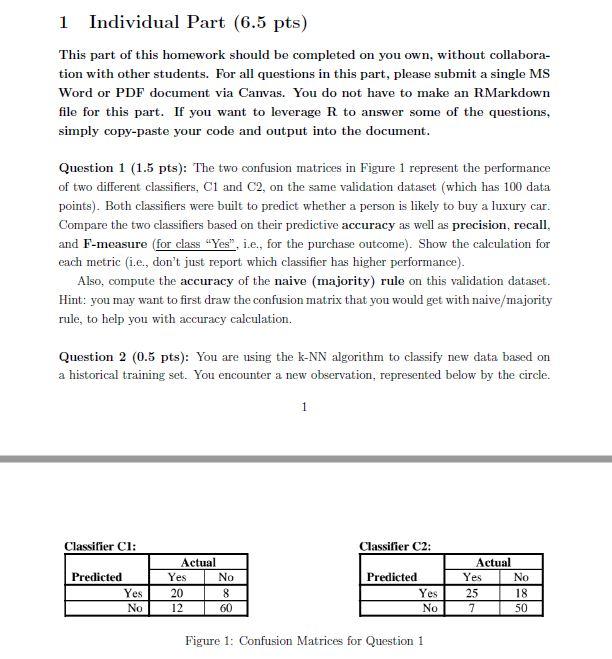
1 Individual Part (6.5 pts) This part of this homework should be completed on you own, without collabora- tion with other students. For all questions in this part, please submit a single MS Word or PDF document via Canvas. You do not have to make an RMarkdown file for this part. If you want to leverage R to answer some of the questions, simply copy-paste your code and output into the document. Question 1 (1.5 pts): The two confusion matrices in Figure 1 represent the performance of two different classifiers, C1 and C2, on the same validation dataset (which has 100 data points). Both classifiers were built to predict whether a person is likely to buy a luxury car. Compare the two classifiers based on their predictive accuracy as well as precision, recall, and F-measure (for class "Yes", i.e., for the purchase outcome). Show the calculation for each metric (i.e., don't just report which classifier has higher performance). Also, compute the accuracy of the naive (majority) rule on this validation dataset. Hint: you may want to first draw the confusion matrix that you would get with naive/majority rule, to help you with accuracy calculation. Question 2 (0.5 pts): You are using the k-NN algorithm to classify new data based on a historical training set. You encounter a new observation, represented below by the circle. 1 Classifier C1: Classifier C2: Predicted Yes No Actual Yes No 20 8 12 Predicted Yes No Actual Yes No 25 18 7 50 60 Figure 1: Confusion Matrices for Question 1 1 Individual Part (6.5 pts) This part of this homework should be completed on you own, without collabora- tion with other students. For all questions in this part, please submit a single MS Word or PDF document via Canvas. You do not have to make an RMarkdown file for this part. If you want to leverage R to answer some of the questions, simply copy-paste your code and output into the document. Question 1 (1.5 pts): The two confusion matrices in Figure 1 represent the performance of two different classifiers, C1 and C2, on the same validation dataset (which has 100 data points). Both classifiers were built to predict whether a person is likely to buy a luxury car. Compare the two classifiers based on their predictive accuracy as well as precision, recall, and F-measure (for class "Yes", i.e., for the purchase outcome). Show the calculation for each metric (i.e., don't just report which classifier has higher performance). Also, compute the accuracy of the naive (majority) rule on this validation dataset. Hint: you may want to first draw the confusion matrix that you would get with naive/majority rule, to help you with accuracy calculation. Question 2 (0.5 pts): You are using the k-NN algorithm to classify new data based on a historical training set. You encounter a new observation, represented below by the circle. 1 Classifier C1: Classifier C2: Predicted Yes No Actual Yes No 20 8 12 Predicted Yes No Actual Yes No 25 18 7 50 60 Figure 1: Confusion Matrices for Question 1


