1. Is Mercury an appropriate target for AGI? Why or why not?
2. Estimate the value of Mercury using a discount cash flow approach. Please show calculation steps for the FCF, WACC, and Enterprise Value.
Please explain and show work so i understand. thank you.
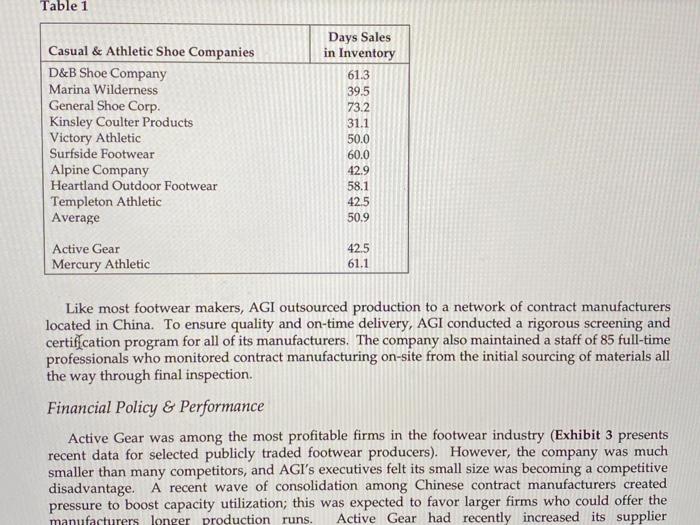
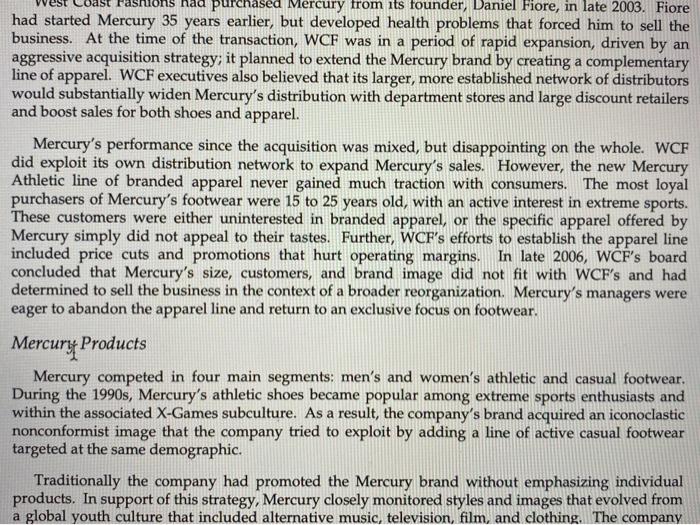
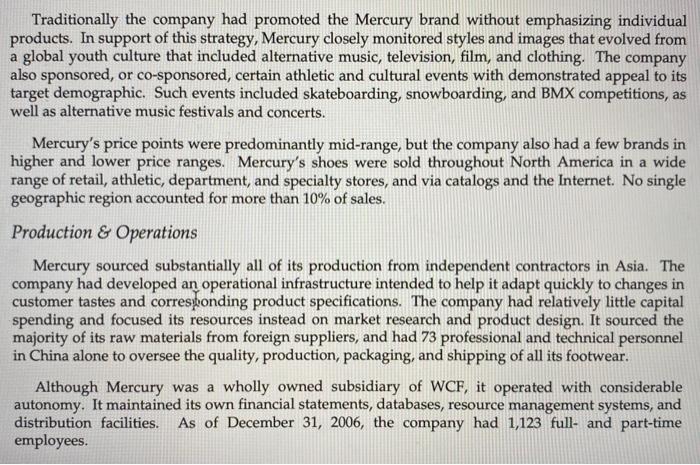
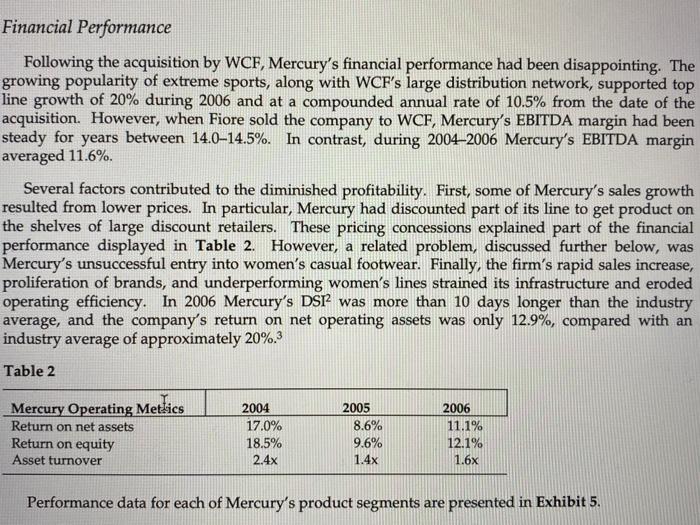
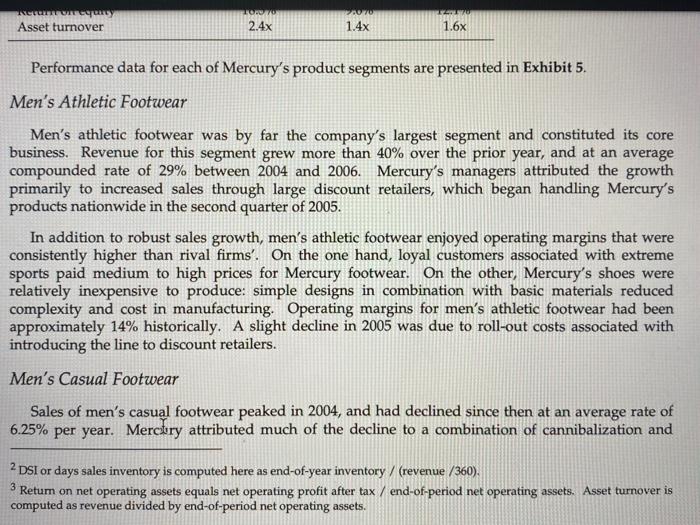
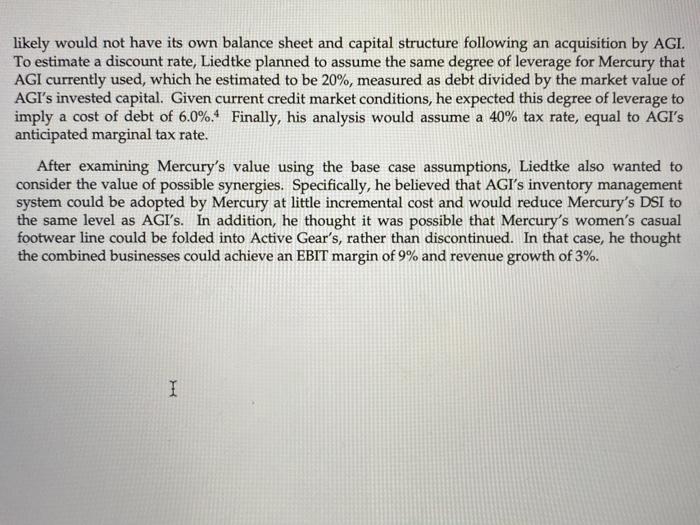
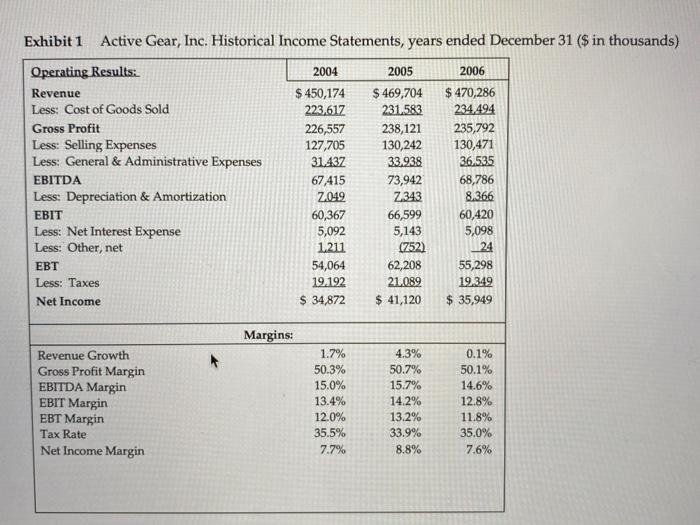
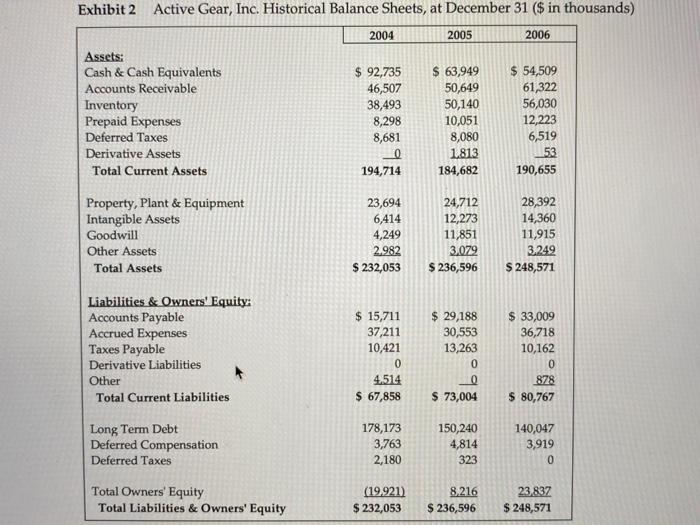
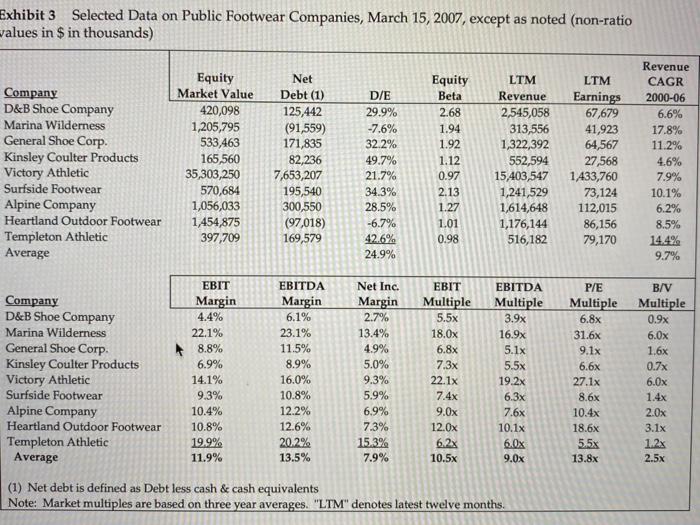
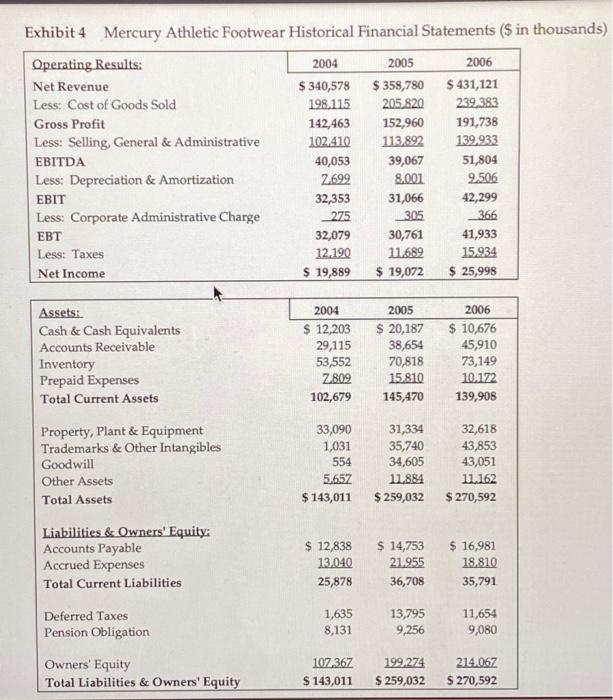
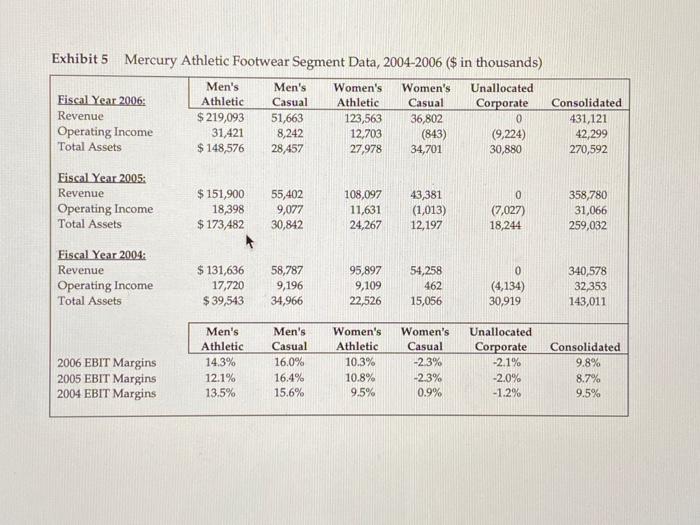
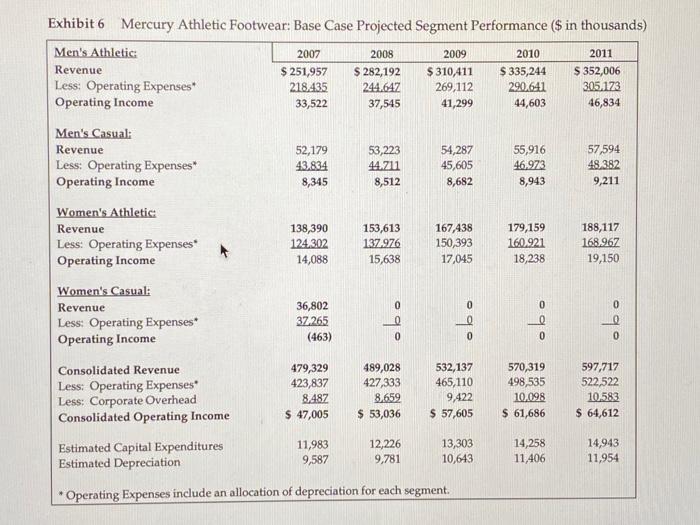
Mercury Athletic Footwear: Valuing the Opportunity In March 2007, John Liedtke, the head of business development for Active Gear, Inc., a privately held footwear company, was contemplating an acquisition opportunity. West Coast Fashions, Inc. (WCF), a large designer and marketer of men's and women's branded apparel had recently announced plans for a strategic reorganization. The plan called for a divestiture of certain non-core assets and a renewed focus on WCF's higher-end business, business-casual, and formal-wear apparel businesses. One of the divisions WCF intended to shed was Mercury Athletic, its footwear division. Liedtke knew that acquiring Mercury would roughly double Active Gear's revenue, increase its leverage with contract manufacturers, and expand its presence with key retailers and distributors. He also expected that Active Gear's bankers would quickly approach the company about a possible bid for Mercury, consequently, he wanted to complete his own rough evaluation of the opportunity before hearing the bankers' pitch. Athletic and Casual Footwear Industry Footwear was a mature, highly competitive industry marked by low growth, but fairly stable profit margins. Despite the industry's overall stability, the performance of individual firms could be quite volatile as they vied with one another to anticipate and exploit fashion trends. The market for athletic and casual shoes remained fragmented, despite the presence of a small number of global footwear brands. In the casual segment, companies competed on the basis of style, price, and general quality. In the athletic segment, competition revolved around brand image, specialized engineering for performance, and price. Within the fashion-sensitive part of the industry, product lifecycles tended to be short, sometimes lasting only a season. Consequently, active management of inventory and production lead times were critical success factors. Although a few firms sold their products in company-owned retail stores, the large majority of athletic and casual footwear was sold through department stores, independent specialty retailers, sporting goods stores, boutiques, and wholesalers. In 2007, many companies were actively engaged in attempts to sell directly to customers via web-based e-commerce platforms. So far, successes in this venue had been small in both size and number. New footwear was produced on a cycle that required 8 to 10 months to complete a new design, associated samples, and production specifications. Another 4 to 6 months were required for manufacturing start-up before new orders could be filled. Despite significant import taxes and tariffs in the United States and European Union, the great majority of North American and European footwear companies used independent contract manufacturers to produce their shoes. Most of these independent manufacturers were located in China.1 Active Gear, Inc. Active Gear (AGI) was founded in 1965 to produce and market high-quality specialty shoes for golf and tennis players. The company's products were among the first to incorporate sculpted cushioned insoles and a selection of high-performance tread patterns designed for specific surfaces and/or playing conditions. AGI began selling its shoes primarily in golf and tennis pro shops and a few specialty sporting goods stores. As its products became more established, AGI moved into larger department and retail stores. The company also exported its shoes to Europe and, to a lesser extent, Japan. Sales outside the United States were made through a network of wholesalers, which the company still employed in 2007. Beginning in the 1970s, Active Gear moved into casual and recreational footwear aimed at what had become its core customer demographic: affluent urban and suburban family members aged 25 to 45. AGI was among the first companies to offer fashionable walking, hiking, and boating footwear. By the early 1980s, the Active Gear brand and logo were associated with a lifestyle that was prosperous, active, and fashion-conscious. After years of steady if unspectacular growth, AGI's 2006 revenue and operating income were $470.3 million and $60.4 million, respectively, with 42% of revenue from athletic shoes and the $470.3 million and $60.4 million, respectively, with 42% of revenue from athletic shoes and the balance from casual footwear. [Historical income statements and balance sheets for AGI are presented in Exhibits 1 and 2.) The firm's athletic shoes had evolved from high-performance footwear to athletic fashion wear with a classic image. The company's traditional casual shoes also offered classic styling, but were aimed at a broader, more mainstream market. AGI's casual footwear was sold by more than 5,700 North American department, specialty, and general retail stores via a network of wholesalers and independent distributors. Sales of athletic footwear were made through independent sales representatives to a limited number of sporting goods stores, pro shops, and specialty athletic footwear retailers. A small percentage of both casual and athletic shoes were sold through Active Gear's website. By focusing on a smaller portfolio of classic products with longer lifecycles, Active Gear was able to maintain relatively simple production and supply chains. This in turn allowed the firm to avoid the worst of the industry's cycles of inventory write-downs and missed profit opportunities. AGI's simplified approach to brand and inventory management also contributed to its strong operating margins. Table 1 shows AGI's Days Sales in Inventory compared to Mercury and other selected footwear producers. Table 1 Casual & Athletic Shoe Companies D&B Shoe Company Marina Wilderness General Shoe Corp. Kinsley Coulter Products Victory Athletic Surfside Footwear Alpine Company Heartland Outdoor Footwear Templeton Athletic Average Days Sales in Inventory 61.3 39.5 73.2 31.1 50.0 60.0 42.9 58.1 42.5 50.9 Active Gear Mercury Athletic 42.5 61.1 Like most footwear makers, AGI outsourced production to a network of contract manufacturers located in China. To ensure quality and on-time delivery, AGI conducted a rigorous screening and certification program for all of its manufacturers. The company also maintained a staff of 85 full-time professionals who monitored contract manufacturing on-site from the initial sourcing of materials all the way through final inspection Financial Policy & Performance Active Gear was among the most profitable firms in the footwear industry (Exhibit 3 presents recent data for selected publicly traded footwear producers). However, the company was much smaller than many competitors, and AGI's executives felt its small size was becoming a competitive disadvantage. A recent wave of consolidation among Chinese contract manufacturers created pressure to boost capacity utilization; this was expected to favor larger firms who could offer the manufacturers longer production runs. Active Gear had recently increased its supplier disadvantage. A recent wave of consolidation among Chinese contract manufacturers created pressure to boost capacity utilization; this was expected to favor larger firms who could offer the manufacturers longer production runs. Active Gear had recently increased its supplier concentration-reducing the number of its contract manufacturers-in an effort to improve its negotiating position. Until recently, AGI's largest supplier accounted for no more than 12% of its volume; by 2006 this figure was approximately 20%, and the two next-largest firms together accounted for 22%. On the customer side, the rise of "big box" retailers threatened AGI's growth. To protect the company's brand image, Active Gear did not sell through discount retailers. While this policy helped preserve operating margins, it was believed to have hurt sales growth. During 2000-2006 AGI grew its reyenue at a compound average rate of only 6% per year compared with nearly 10% for the group shown in Exhibit 3. During the past three years AGI grew even more slowlyat an average annual rate of only 2.2%. Continuing pressure from suppliers and competitors caused some deterioration of basic performance metrics, such as return on net operating assets, return on equity, and asset turnover, during 2004-2006 (see Exhibit 1). Mercury Athletic Footwear Mercury Athletic Footwear designed and distributed branded athletic and casual footwear, principally to the youth market. Its 2006 revenue and EBITDA were $431.1 million and $51.8 million, respectively. Exhibit 4 presents recent income statements and balance sheets for Mercury. na purchased Mercury from its founder, Daniel Fiore, in late 2003. Fiore had started Mercury 35 years earlier, but developed health problems that forced him to sell the business. At the time of the transaction, WCF was in a period of rapid expansion, driven by an aggressive acquisition strategy; it planned to extend the Mercury brand by creating a complementary line of apparel. WCF executives also believed that its larger, more established network of distributors would substantially widen Mercury's distribution with department stores and large discount retailers and boost sales for both shoes and apparel. Mercury's performance since the acquisition was mixed, but disappointing on the whole. WCF did exploit its own distribution network to expand Mercury's sales. However, the new Mercury Athletic line of branded apparel never gained much traction with consumers. The most loyal purchasers of Mercury's footwear were 15 to 25 years old, with an active interest in extreme sports. These customers were either uninterested in branded apparel, or the specific apparel offered by Mercury simply did not appeal to their tastes. Further, WCF's efforts to establish the apparel line included price cuts and promotions that hurt operating margins. In late 2006, WCF's board concluded that Mercury's size, customers, and brand image did not fit with WCF's and had determined to sell the business in the context of a broader reorganization. Mercury's managers were eager to abandon the apparel line and return to an exclusive focus on footwear. Mercury Products Mercury competed in four main segments: men's and women's athletic and casual footwear. During the 1990s, Mercury's athletic shoes became popular among extreme sports enthusiasts and within the associated X-Games subculture. As a result, the company's brand acquired an iconoclastic nonconformist image that the company tried to exploit by adding a line of active casual footwear targeted at the same demographic. Traditionally the company had promoted the Mercury brand without emphasizing individual products. In support of this strategy, Mercury closely monitored styles and images that evolved from a global youth culture that included alternative music, television, film, and clothing. The company Traditionally the company had promoted the Mercury brand without emphasizing individual products. In support of this strategy, Mercury closely monitored styles and images that evolved from a global youth culture that included alternative music, television, film, and clothing. The company also sponsored, or co-sponsored, certain athletic and cultural events with demonstrated appeal to its target demographic. Such events included skateboarding, snowboarding, and BMX competitions, as well as alternative music festivals and concerts. Mercury's price points were predominantly mid-range, but the company also had a few brands in higher and lower price ranges. Mercury's shoes were sold throughout North America in a wide range of retail, athletic, department, and specialty stores, and via catalogs and the Internet. No single geographic region accounted for more than 10% of sales. Production & Operations Mercury sourced substantially all of its production from independent contractors in Asia. The company had developed an operational infrastructure intended to help it adapt quickly to changes in customer tastes and corresponding product specifications. The company had relatively little capital spending and focused its resources instead on market research and product design. It sourced the majority of its raw materials from foreign suppliers, and had 73 professional and technical personnel in China alone to oversee the quality, production, packaging, and shipping of all its footwear. Although Mercury was a wholly owned subsidiary of WCF, it operated with considerable autonomy. It maintained its own financial statements, databases, resource management systems, and distribution facilities. As of December 31, 2006, the company had 1,123 full- and part-time employees. Financial Performance Following the acquisition by WCF, Mercury's financial performance had been disappointing. The growing popularity of extreme sports, along with WCF's large distribution network, supported top line growth of 20% during 2006 and at a compounded annual rate of 10.5% from the date of the acquisition. However, when Fiore sold the company to WCF, Mercury's EBITDA margin had been steady for years between 14.014.5%. In contrast, during 20042006 Mercury's EBITDA margin averaged 11.6%. Several factors contributed to the diminished profitability. First, some of Mercury's sales growth resulted from lower prices. In particular, Mercury had discounted part of its line to get product on the shelves of large discount retailers. These pricing concessions explained part of the financial performance displayed in Table 2. However, a related problem, discussed further below, was Mercury's unsuccessful entry into women's casual footwear. Finally, the firm's rapid sales increase, proliferation of brands, and underperforming women's lines strained its infrastructure and eroded operating efficiency. In 2006 Mercury's DSI was more than 10 days longer than the industry average, and the company's return on net operating assets was only 12.9%, compared with an industry average of approximately 20%.3 Table 2 Mercury Operating Metlics Return on net assets Return on equity Asset turnover 2004 17.0% 18.5% 2.4x 2005 8.6% 9.6% 1.4x 2006 11.1% 12.1% 1.6X Performance data for each of Mercury's product segments are presented in Exhibit 5. KUNCTy Asset turnover TOTO 2.4x 20070 1.4x 1.6x Performance data for each of Mercury's product segments are presented in Exhibit 5. Men's Athletic Footwear Men's athletic footwear was by far the company's largest segment and constituted its core business. Revenue for this segment grew more than 40% over the prior year, and at an average compounded rate of 29% between 2004 and 2006. Mercury's managers attributed the growth primarily to increased sales through large discount retailers, which began handling Mercury's products nationwide in the second quarter of 2005. In addition to robust sales growth, men's athletic footwear enjoyed operating margins that were consistently higher than rival firms'. On the one hand, loyal customers associated with extreme sports paid medium to high prices for Mercury footwear. On the other, Mercury's shoes were relatively inexpensive to produce: simple designs in combination with basic materials reduced complexity and cost in manufacturing. Operating margins for men's athletic footwear had been approximately 14% historically. A slight decline in 2005 was due to roll-out costs associated with introducing the line to discount retailers. Men's Casual Footwear Sales of men's casual footwear peaked in 2004, and had declined since then at an average rate of 6.25% per year. Mercury attributed much of the decline to a combination of cannibalization and 2 DSI or days sales inventory is computed here as end-of-year inventory / (revenue /360). Retum on net operating assets equals net operating profit after tax / end-of-period net operating assets. Asset turnover is computed as revenue divided by end-of-period net operating assets. 3 unfortunate shipping problems. The firm introduced a new fashion line for the 2005 holiday season that was received enthusiastically by retailers, who placed strong orders. When bad weather and strikes by dockworkers delayed deliveries, Mercury's holiday sales were disappointing: stores had trimmed their orders for Mercury's existing men's casual products to make room for the new line, which showed up late. When sales failed to recover satisfactorily in 2006, Mercury took steps to upgrade parts of the line and boost support of the casual segment generally. As a result, Mercury expected 2007 and following years to show steady improvement. Despite its small size and recent sales declines, the men's casual segment consistently posted Mercury's highest profit margins. High profitability was attributed to a marketing and distribution strategy in which casual products were sold exclusively through specialty shops with proven ability to reach the youth demographic. In addition to supporting prices, the exclusivity reinforced the brand's image. Finally, this set of retailers tended to be quite fragmented, and most lacked a national footprint, which allowed Mercury to obtain very favorable terms. Women's Athletic Footwear In contrast to the relative strength of the men's lines, Mercury's lines for women had subpar performance. Women's athletic footwear turned in solid sales growth, averaging 13.5% per year during 20042006. However, as with the men's line, much of this growth was due to the recent introduction of Mercury's shoes to large discount retailers. An equally important driver was the growing participation of women in extreme sports. Operating margins for women's athletic footwear averaged just over 10%, which was below the industry mean of 11.9%. Mercury's managers felt the primary reason for lower margins was the high cost of building brand image and awareness among women. Prior to the acquisition by WCF, Mercury had done almost no marketing specifically targeted at female consumers. Since then, targeted advertising and promotional programs had improved the brand's standing among women, and Mercury's managers anticipated better margins in the immediate future. Mercury had done almost no marketing specifically targeted at female consumers. Since then, targeted advertising and promotional programs had improved the brand's standing among women, and Mercury's managers anticipated better margins in the immediate future. Women's Casual Footwear Women's casual footwear was Mercury's worst-performing line of shoes. WCF had expected that its expertise in marketing upscale women's apparel would naturally boost the line of women's casual footwear that Mercury introduced just after the acquisition. The new line was launched with heavy promotion in 2004, but sales began to falter in 2005, as soon as promotional support was reduced. During 20042006 sales dropped alarmingly, which led to multiple rounds of inventory write-downs. These in turn further eroded margins and led to operating losses. By the end of 2006, the line was considered all but dead and Mercury's managers were not eager to try the experiment again. Valuing Mercury Athletic To perform a preliminary valuation, Liedtke developed a base case set of financial projections based on forecasts of revenue and operating income for each of Mercury's four main segments as shown in Exhibit 6. Liedtke's base case assumed that women's casual footwear would be wound down within one year following an acquisition, as he doubted that WCF would be willing to sell Mercury without it. He further assumed that Mercury's historical corporate overhead-to-revenue ratio would conform to historical averages. To accompany the operating projections, Liedtke prepared projections for certain balance sheet accounts for Mercury, shown in Exhibit 7; these corresponded to operating assets and liabilities that Liedtke expected would be required to support his operating projections. He did not prepare projections for debt or equity accounts since Mercury likely would not have its own balance sheet and capital structure following an acquisition by AGI. To estimate a discount rate, Liedtke planned to assume the same degree of leverage for Mercury that AGI currently used, which he estimated to be 20%, measured as debt divided by the market value of AGI's invested capital. Given current credit market conditions, he expected this degree of leverage to imply a cost of debt of 6.0%. Finally, his analysis would assume a 40% tax rate, equal to AGI's anticipated marginal tax rate. After examining Mercury's value using the base case assumptions, Liedtke also wanted to consider the value of possible synergies. Specifically, he believed that AGI's inventory management system could be adopted by Mercury at little incremental cost and would reduce Mercury's DSI to the same level as AGI's. In addition, he thought it was possible that Mercury's women's casual footwear line could be folded into Active Gear's, rather than discontinued. In that case, he thought the combined businesses could achieve an EBIT margin of 9% and revenue growth of 3%. I Exhibit 1 Active Gear, Inc. Historical Income Statements, years ended December 31 ($ in thousands) 2004 2005 2006 Operating Results: Revenue Less: Cost of Goods Sold Gross Profit Less: Selling Expenses Less: General & Administrative Expenses EBITDA Less: Depreciation & Amortization EBIT Net Interest Expense Less: Other, net EBT Less: Taxes Net Income $ 450,174 223,617 226,557 127,705 31.437 67,415 2.049 60,367 5,092 1.211 54,064 19.192 $ 34,872 $469,704 231.583 238,121 130,242 33.938 73,942 7343 66,599 5,143 (752) 62,208 21.089 $ 41,120 $ 470,286 234,494 235,792 130,471 36.535 68,786 8,366 60,420 5,098 24 55,298 19,349 $ 35,949 Margins: Revenue Growth Gross Profit Margin EBITDA Margin EBIT Margin EBT Margin Tax Rate Net Income Margin 1.7% 50.3% 15.0% 13.4% 12.0% 35.5% 7.7% 4.3% 50.7% 15.7% 14.2% 13.2% 33.9% 8.8% 0.1% 50.1% 14.6% 12.8% 11.8% 35.0% 7.6% Exhibit 2 Active Gear, Inc. Historical Balance Sheets, at December 31 ($ in thousands) 2004 2005 2006 Assets: Cash & Cash Equivalents Accounts Receivable Inventory Prepaid Expenses Deferred Taxes Derivative Assets Total Current Assets $ 92,735 46,507 38,493 8,298 8,681 $ 63,949 50,649 50,140 10,051 8,080 1.813 184,682 $ 54,509 61,322 56,030 12,223 6,519 53 190,655 194,714 Property, Plant & Equipment Intangible Assets Goodwill Other Assets Total Assets 23,694 6,414 4,249 2.982 $ 232,053 24,712 12,273 11,851 3,072 $ 236,596 28,392 14,360 11,915 3.249 $ 248,571 Liabilities & Owners' Equity: Accounts Payable Accrued Expenses Taxes Payable Derivative Liabilities Other Total Current Liabilities $ 15,711 37,211 10,421 0 4.514 $ 67,858 $ 29,188 30,553 13,263 0 0 $ 73,004 $ 33,009 36,718 10,162 0 878 $ 80,767 Long Term Debt Deferred Compensation Deferred Taxes 178,173 3,763 2,180 150,240 4,814 323 140,047 3,919 0 Total Owners' Equity Total Liabilities & Owners' Equity (19.921) $ 232,053 8.216 $ 236,596 23,837 $ 248,571 Exhibit 3 Selected Data on Public Footwear Companies, March 15, 2007, except as noted (non-ratio alues in $ in thousands) Company D&B Shoe Company Marina Wilderness General Shoe Corp. Kinsley Coulter Products Victory Athletic Surfside Footwear Alpine Company Heartland Outdoor Footwear Templeton Athletic Average Equity Market Value 420,098 1,205,795 533,463 165,560 35,303,250 570,684 1,056,033 1,454,875 397,709 Net Debt (1) 125,442 (91,559) 171,835 82,236 7,653,207 195,540 300,550 (97,018) 169,579 D/E 29.9% -7.6% 32.2% 49.7% 21.7% 34.3% 28.5% -6.7% 42.6% 24.9% Equity Beta 2.68 1.94 1.92 1.12 0.97 2.13 1.27 1.01 0.98 LTM Revenue 2,545,058 313,556 1,322,392 552,594 15,403,547 1,241,529 1,614,648 1,176,144 516,182 LTM Earnings 67,679 41,923 64,567 27,568 1,433,760 73,124 112,015 86,156 79,170 Revenue CAGR 2000-06 6.6% 17.8% 11.2% 4.6% 7.9% 10.1% 6.2% 8.5% 14.4% 9.7% Company D&B Shoe Company Marina Wilderness General Shoe Corp Kinsley Coulter Products Victory Athletic Surfside Footwear Alpine Company Heartland Outdoor Footwear Templeton Athletic Average EBIT Margin 4.4% 22.1% 8.8% 6.9% 14.1% 9.3% 10.4% 10.8% 19.9% 11.9% EBITDA Margin 6.1% 23.1% 11.5% 8.9% 16.0% 10.8% 12.2% 12.6% 20.2% 13.5% Net Inc. Margin 2.7% 13.4% 4.9% 5.0% 9.3% 5.9% 6.9% 7.3% 15.3% 7.9% EBIT Multiple 5.5x 18.0x 6.8x 7.3x 22.1x 7.4x 9.0x 12.0x EBITDA Multiple 3.9x 16.9x 5.1x 5.5x 19.2x 6.3x 7.6x 10.1x 6.0x 9.0x P/E Multiple 6.8x 31.6x 9.1x 6.6x 27.1x 8.6x 10.4x 18.6x 5.5x 13.8x B/V Multiple 0.9x 6.0x 1.6x 0.7x 6.Ox 1.4x 2.0x 3.1x 1.2x 2.5x 10.5x (1) Net debt is defined as Debt less cash & cash equivalents Note: Market multiples are based on three year averages. "LTM" denotes latest twelve months. Exhibit 4 Mercury Athletic Footwear Historical Financial Statements ($ in thousands) Operating Results: 2004 2005 2006 Net Revenue $ 340,578 $ 358,780 $ 431,121 Less: Cost of Goods Sold 198.115 205,820 239.383 Gross Profit 142,463 152,960 191,738 Less: Selling, General & Administrative 102.410 113,892 139.933 EBITDA 40,053 39,067 51,804 Less: Depreciation & Amortization 2699 8.001 2.506 EBIT 32,353 31,066 42,299 Less: Corporate Administrative Charge 3.05 366 EBT 32,079 30,761 41,933 Less: Taxes 12.190 11.689 15.934 Net Income $ 19,889 $ 19,072 $ 25,998 275 Assets: Cash & Cash Equivalents Accounts Receivable Inventory Prepaid Expenses Total Current Assets 2004 $ 12,203 29,115 53,552 7802 102,679 2005 $ 20,187 38,654 70,818 15,810 145,470 2006 $ 10,676 45,910 73,149 10.172 139,908 Property, Plant & Equipment Trademarks & Other Intangibles Goodwill Other Assets Total Assets 33,090 1,031 554 5.657 $ 143,011 31,334 35,740 34,605 11.884 $ 259,032 32,618 43,853 43,051 11.162 $ 270,592 Liabilities & Owners' Equity: Accounts Payable Accrued Expenses Total Current Liabilities $ 12,838 13.040 25,878 $ 14,753 21.955 36,708 $ 16,981 18.810 35,791 Deferred Taxes Pension Obligation 1,635 8,131 13,795 9,256 11,654 9,080 Owners' Equity Total Liabilities & Owners' Equity 107 367 $ 143,011 199.274 $ 259,032 214.067 $ 270,592 Exhibit 5 Mercury Athletic Footwear Segment Data, 2004-2006 ($ in thousands) Men's Men's Women's Women's Unallocated Fiscal Year 2006: Athletic Casual Athletic Casual Corporate Revenue $ 219,093 51,663 123,563 36,802 0 Operating Income 31,421 8,242 12,703 (843) (9,224) Total Assets $ 148,576 28,457 27,978 34,701 30,880 Consolidated 431,121 42,299 270,592 Fiscal Year 2005 Revenue Operating Income Total Assets $ 151,900 18,398 $ 173,482 55,402 9,077 30,842 108,097 11,631 24,267 43,381 (1,013) 12,197 0 (7,027) 18,244 358,780 31,066 259,032 Fiscal Year 2004: Revenue Operating Income Total Assets $ 131,636 17,720 $ 39,543 58,787 9,196 34,966 95,897 9,109 22,526 54,258 462 15,056 0 (4,134) 30,919 340,578 32,353 143,011 2006 EBIT Margins 2005 EBIT Margins 2004 EBIT Margins Men's Athletic 14.3% 12.1% 13.5% Men's Casual 16.0% 16.4% 15.6% Women's Athletic 10.3% 10.8% 9.5% Women's Casual -2.3% -2.3% 0.9% Unallocated Corporate -2.1% -2.0% -1.2% Consolidated 9.8% 8.7% 9.5% Exhibit 6 Mercury Athletic Footwear: Base Case Projected Segment Performance ($ in thousands) Men's Athletic 2007 2008 2009 2010 2011 Revenue $ 251,957 $ 282,192 $ 310,411 $ 335,244 $ 352,006 Less: Operating Expenses 218,435 244.647 269,112 290.641 305.173 Operating Income 33,522 37,545 41,299 44,603 46,834 Men's Casual: Revenue Less: Operating Expenses Operating Income 52,179 43.834 8,345 53,223 44.711 8,512 54,287 45,605 8,682 55,916 46.973 8,943 57,594 48.382 9,211 138,390 124.302 14,088 153,613 137.976 15,638 167,438 150,393 17,045 179,159 160.921 18,238 188,117 168.967 19,150 Women's Athletic Revenue Less: Operating Expenses Operating Income Women's Casual Revenue Less: Operating Expenses Operating Income 0 36,802 37265 (463) 090 0 9 0 0 0 0 Consolidated Revenue Less: Operating Expenses Less: Corporate Overhead Consolidated Operating Income 479,329 423,837 8,487 $ 47,005 489,028 427,333 8.659 $ 53,036 532,137 465,110 9,422 $ 57,605 570,319 498,535 10,098 $ 61,686 597,717 522,522 10583 $ 64,612 Estimated Capital Expenditures Estimated Depreciation 11,983 9,587 12,226 9,781 13,303 10,643 14,258 11,406 14,943 11,954 2 * Operating Expenses include an allocation of depreciation for each segment. Exhibit 7 Mercury Athletic Footwear: Projection of Selected Balance Sheet Accounts; 2007-2011 ($ in thousands) 2007 2008 2009 2010 2011 Selected Balance Sheet Accounts:. Assets Cash Used in Operations Accounts Receivable Inventory Prepaid Expenses $ 4,161 47,888 83,770 14,474 $ 4,195 48,857 85,465 14,767 $ 4,566 53,164 92,999 16,069 $ 4,894 56,978 99,672 17,222 $ 5,130 59,715 104,460 18,049 Property, Plant & Equipment Trademarks & Other Intangibles Goodwill Other Assets 35,015 43,853 43,051 11,162 37,460 43,853 43,051 11,162 40,120 43,853 43,051 11,162 42,972 43,853 43,051 11,162 45,961 43,853 43,051 11,162 Liabilities Accounts Payable Accrued Expenses $ 18,830 22,778 $ 18,985 22,966 $ 20,664 24,996 $ 22,149 26,792 $ 23,214 28,081 Deferred Taxes Pension Obligation 11,654 9,080 11,654 9,080 11,654 9,080 11,654 9,080 11,654 9,080 Mercury Athletic Footwear: Valuing the Opportunity In March 2007, John Liedtke, the head of business development for Active Gear, Inc., a privately held footwear company, was contemplating an acquisition opportunity. West Coast Fashions, Inc. (WCF), a large designer and marketer of men's and women's branded apparel had recently announced plans for a strategic reorganization. The plan called for a divestiture of certain non-core assets and a renewed focus on WCF's higher-end business, business-casual, and formal-wear apparel businesses. One of the divisions WCF intended to shed was Mercury Athletic, its footwear division. Liedtke knew that acquiring Mercury would roughly double Active Gear's revenue, increase its leverage with contract manufacturers, and expand its presence with key retailers and distributors. He also expected that Active Gear's bankers would quickly approach the company about a possible bid for Mercury, consequently, he wanted to complete his own rough evaluation of the opportunity before hearing the bankers' pitch. Athletic and Casual Footwear Industry Footwear was a mature, highly competitive industry marked by low growth, but fairly stable profit margins. Despite the industry's overall stability, the performance of individual firms could be quite volatile as they vied with one another to anticipate and exploit fashion trends. The market for athletic and casual shoes remained fragmented, despite the presence of a small number of global footwear brands. In the casual segment, companies competed on the basis of style, price, and general quality. In the athletic segment, competition revolved around brand image, specialized engineering for performance, and price. Within the fashion-sensitive part of the industry, product lifecycles tended to be short, sometimes lasting only a season. Consequently, active management of inventory and production lead times were critical success factors. Although a few firms sold their products in company-owned retail stores, the large majority of athletic and casual footwear was sold through department stores, independent specialty retailers, sporting goods stores, boutiques, and wholesalers. In 2007, many companies were actively engaged in attempts to sell directly to customers via web-based e-commerce platforms. So far, successes in this venue had been small in both size and number. New footwear was produced on a cycle that required 8 to 10 months to complete a new design, associated samples, and production specifications. Another 4 to 6 months were required for manufacturing start-up before new orders could be filled. Despite significant import taxes and tariffs in the United States and European Union, the great majority of North American and European footwear companies used independent contract manufacturers to produce their shoes. Most of these independent manufacturers were located in China.1 Active Gear, Inc. Active Gear (AGI) was founded in 1965 to produce and market high-quality specialty shoes for golf and tennis players. The company's products were among the first to incorporate sculpted cushioned insoles and a selection of high-performance tread patterns designed for specific surfaces and/or playing conditions. AGI began selling its shoes primarily in golf and tennis pro shops and a few specialty sporting goods stores. As its products became more established, AGI moved into larger department and retail stores. The company also exported its shoes to Europe and, to a lesser extent, Japan. Sales outside the United States were made through a network of wholesalers, which the company still employed in 2007. Beginning in the 1970s, Active Gear moved into casual and recreational footwear aimed at what had become its core customer demographic: affluent urban and suburban family members aged 25 to 45. AGI was among the first companies to offer fashionable walking, hiking, and boating footwear. By the early 1980s, the Active Gear brand and logo were associated with a lifestyle that was prosperous, active, and fashion-conscious. After years of steady if unspectacular growth, AGI's 2006 revenue and operating income were $470.3 million and $60.4 million, respectively, with 42% of revenue from athletic shoes and the $470.3 million and $60.4 million, respectively, with 42% of revenue from athletic shoes and the balance from casual footwear. [Historical income statements and balance sheets for AGI are presented in Exhibits 1 and 2.) The firm's athletic shoes had evolved from high-performance footwear to athletic fashion wear with a classic image. The company's traditional casual shoes also offered classic styling, but were aimed at a broader, more mainstream market. AGI's casual footwear was sold by more than 5,700 North American department, specialty, and general retail stores via a network of wholesalers and independent distributors. Sales of athletic footwear were made through independent sales representatives to a limited number of sporting goods stores, pro shops, and specialty athletic footwear retailers. A small percentage of both casual and athletic shoes were sold through Active Gear's website. By focusing on a smaller portfolio of classic products with longer lifecycles, Active Gear was able to maintain relatively simple production and supply chains. This in turn allowed the firm to avoid the worst of the industry's cycles of inventory write-downs and missed profit opportunities. AGI's simplified approach to brand and inventory management also contributed to its strong operating margins. Table 1 shows AGI's Days Sales in Inventory compared to Mercury and other selected footwear producers. Table 1 Casual & Athletic Shoe Companies D&B Shoe Company Marina Wilderness General Shoe Corp. Kinsley Coulter Products Victory Athletic Surfside Footwear Alpine Company Heartland Outdoor Footwear Templeton Athletic Average Days Sales in Inventory 61.3 39.5 73.2 31.1 50.0 60.0 42.9 58.1 42.5 50.9 Active Gear Mercury Athletic 42.5 61.1 Like most footwear makers, AGI outsourced production to a network of contract manufacturers located in China. To ensure quality and on-time delivery, AGI conducted a rigorous screening and certification program for all of its manufacturers. The company also maintained a staff of 85 full-time professionals who monitored contract manufacturing on-site from the initial sourcing of materials all the way through final inspection Financial Policy & Performance Active Gear was among the most profitable firms in the footwear industry (Exhibit 3 presents recent data for selected publicly traded footwear producers). However, the company was much smaller than many competitors, and AGI's executives felt its small size was becoming a competitive disadvantage. A recent wave of consolidation among Chinese contract manufacturers created pressure to boost capacity utilization; this was expected to favor larger firms who could offer the manufacturers longer production runs. Active Gear had recently increased its supplier disadvantage. A recent wave of consolidation among Chinese contract manufacturers created pressure to boost capacity utilization; this was expected to favor larger firms who could offer the manufacturers longer production runs. Active Gear had recently increased its supplier concentration-reducing the number of its contract manufacturers-in an effort to improve its negotiating position. Until recently, AGI's largest supplier accounted for no more than 12% of its volume; by 2006 this figure was approximately 20%, and the two next-largest firms together accounted for 22%. On the customer side, the rise of "big box" retailers threatened AGI's growth. To protect the company's brand image, Active Gear did not sell through discount retailers. While this policy helped preserve operating margins, it was believed to have hurt sales growth. During 2000-2006 AGI grew its reyenue at a compound average rate of only 6% per year compared with nearly 10% for the group shown in Exhibit 3. During the past three years AGI grew even more slowlyat an average annual rate of only 2.2%. Continuing pressure from suppliers and competitors caused some deterioration of basic performance metrics, such as return on net operating assets, return on equity, and asset turnover, during 2004-2006 (see Exhibit 1). Mercury Athletic Footwear Mercury Athletic Footwear designed and distributed branded athletic and casual footwear, principally to the youth market. Its 2006 revenue and EBITDA were $431.1 million and $51.8 million, respectively. Exhibit 4 presents recent income statements and balance sheets for Mercury. na purchased Mercury from its founder, Daniel Fiore, in late 2003. Fiore had started Mercury 35 years earlier, but developed health problems that forced him to sell the business. At the time of the transaction, WCF was in a period of rapid expansion, driven by an aggressive acquisition strategy; it planned to extend the Mercury brand by creating a complementary line of apparel. WCF executives also believed that its larger, more established network of distributors would substantially widen Mercury's distribution with department stores and large discount retailers and boost sales for both shoes and apparel. Mercury's performance since the acquisition was mixed, but disappointing on the whole. WCF did exploit its own distribution network to expand Mercury's sales. However, the new Mercury Athletic line of branded apparel never gained much traction with consumers. The most loyal purchasers of Mercury's footwear were 15 to 25 years old, with an active interest in extreme sports. These customers were either uninterested in branded apparel, or the specific apparel offered by Mercury simply did not appeal to their tastes. Further, WCF's efforts to establish the apparel line included price cuts and promotions that hurt operating margins. In late 2006, WCF's board concluded that Mercury's size, customers, and brand image did not fit with WCF's and had determined to sell the business in the context of a broader reorganization. Mercury's managers were eager to abandon the apparel line and return to an exclusive focus on footwear. Mercury Products Mercury competed in four main segments: men's and women's athletic and casual footwear. During the 1990s, Mercury's athletic shoes became popular among extreme sports enthusiasts and within the associated X-Games subculture. As a result, the company's brand acquired an iconoclastic nonconformist image that the company tried to exploit by adding a line of active casual footwear targeted at the same demographic. Traditionally the company had promoted the Mercury brand without emphasizing individual products. In support of this strategy, Mercury closely monitored styles and images that evolved from a global youth culture that included alternative music, television, film, and clothing. The company Traditionally the company had promoted the Mercury brand without emphasizing individual products. In support of this strategy, Mercury closely monitored styles and images that evolved from a global youth culture that included alternative music, television, film, and clothing. The company also sponsored, or co-sponsored, certain athletic and cultural events with demonstrated appeal to its target demographic. Such events included skateboarding, snowboarding, and BMX competitions, as well as alternative music festivals and concerts. Mercury's price points were predominantly mid-range, but the company also had a few brands in higher and lower price ranges. Mercury's shoes were sold throughout North America in a wide range of retail, athletic, department, and specialty stores, and via catalogs and the Internet. No single geographic region accounted for more than 10% of sales. Production & Operations Mercury sourced substantially all of its production from independent contractors in Asia. The company had developed an operational infrastructure intended to help it adapt quickly to changes in customer tastes and corresponding product specifications. The company had relatively little capital spending and focused its resources instead on market research and product design. It sourced the majority of its raw materials from foreign suppliers, and had 73 professional and technical personnel in China alone to oversee the quality, production, packaging, and shipping of all its footwear. Although Mercury was a wholly owned subsidiary of WCF, it operated with considerable autonomy. It maintained its own financial statements, databases, resource management systems, and distribution facilities. As of December 31, 2006, the company had 1,123 full- and part-time employees. Financial Performance Following the acquisition by WCF, Mercury's financial performance had been disappointing. The growing popularity of extreme sports, along with WCF's large distribution network, supported top line growth of 20% during 2006 and at a compounded annual rate of 10.5% from the date of the acquisition. However, when Fiore sold the company to WCF, Mercury's EBITDA margin had been steady for years between 14.014.5%. In contrast, during 20042006 Mercury's EBITDA margin averaged 11.6%. Several factors contributed to the diminished profitability. First, some of Mercury's sales growth resulted from lower prices. In particular, Mercury had discounted part of its line to get product on the shelves of large discount retailers. These pricing concessions explained part of the financial performance displayed in Table 2. However, a related problem, discussed further below, was Mercury's unsuccessful entry into women's casual footwear. Finally, the firm's rapid sales increase, proliferation of brands, and underperforming women's lines strained its infrastructure and eroded operating efficiency. In 2006 Mercury's DSI was more than 10 days longer than the industry average, and the company's return on net operating assets was only 12.9%, compared with an industry average of approximately 20%.3 Table 2 Mercury Operating Metlics Return on net assets Return on equity Asset turnover 2004 17.0% 18.5% 2.4x 2005 8.6% 9.6% 1.4x 2006 11.1% 12.1% 1.6X Performance data for each of Mercury's product segments are presented in Exhibit 5. KUNCTy Asset turnover TOTO 2.4x 20070 1.4x 1.6x Performance data for each of Mercury's product segments are presented in Exhibit 5. Men's Athletic Footwear Men's athletic footwear was by far the company's largest segment and constituted its core business. Revenue for this segment grew more than 40% over the prior year, and at an average compounded rate of 29% between 2004 and 2006. Mercury's managers attributed the growth primarily to increased sales through large discount retailers, which began handling Mercury's products nationwide in the second quarter of 2005. In addition to robust sales growth, men's athletic footwear enjoyed operating margins that were consistently higher than rival firms'. On the one hand, loyal customers associated with extreme sports paid medium to high prices for Mercury footwear. On the other, Mercury's shoes were relatively inexpensive to produce: simple designs in combination with basic materials reduced complexity and cost in manufacturing. Operating margins for men's athletic footwear had been approximately 14% historically. A slight decline in 2005 was due to roll-out costs associated with introducing the line to discount retailers. Men's Casual Footwear Sales of men's casual footwear peaked in 2004, and had declined since then at an average rate of 6.25% per year. Mercury attributed much of the decline to a combination of cannibalization and 2 DSI or days sales inventory is computed here as end-of-year inventory / (revenue /360). Retum on net operating assets equals net operating profit after tax / end-of-period net operating assets. Asset turnover is computed as revenue divided by end-of-period net operating assets. 3 unfortunate shipping problems. The firm introduced a new fashion line for the 2005 holiday season that was received enthusiastically by retailers, who placed strong orders. When bad weather and strikes by dockworkers delayed deliveries, Mercury's holiday sales were disappointing: stores had trimmed their orders for Mercury's existing men's casual products to make room for the new line, which showed up late. When sales failed to recover satisfactorily in 2006, Mercury took steps to upgrade parts of the line and boost support of the casual segment generally. As a result, Mercury expected 2007 and following years to show steady improvement. Despite its small size and recent sales declines, the men's casual segment consistently posted Mercury's highest profit margins. High profitability was attributed to a marketing and distribution strategy in which casual products were sold exclusively through specialty shops with proven ability to reach the youth demographic. In addition to supporting prices, the exclusivity reinforced the brand's image. Finally, this set of retailers tended to be quite fragmented, and most lacked a national footprint, which allowed Mercury to obtain very favorable terms. Women's Athletic Footwear In contrast to the relative strength of the men's lines, Mercury's lines for women had subpar performance. Women's athletic footwear turned in solid sales growth, averaging 13.5% per year during 20042006. However, as with the men's line, much of this growth was due to the recent introduction of Mercury's shoes to large discount retailers. An equally important driver was the growing participation of women in extreme sports. Operating margins for women's athletic footwear averaged just over 10%, which was below the industry mean of 11.9%. Mercury's managers felt the primary reason for lower margins was the high cost of building brand image and awareness among women. Prior to the acquisition by WCF, Mercury had done almost no marketing specifically targeted at female consumers. Since then, targeted advertising and promotional programs had improved the brand's standing among women, and Mercury's managers anticipated better margins in the immediate future. Mercury had done almost no marketing specifically targeted at female consumers. Since then, targeted advertising and promotional programs had improved the brand's standing among women, and Mercury's managers anticipated better margins in the immediate future. Women's Casual Footwear Women's casual footwear was Mercury's worst-performing line of shoes. WCF had expected that its expertise in marketing upscale women's apparel would naturally boost the line of women's casual footwear that Mercury introduced just after the acquisition. The new line was launched with heavy promotion in 2004, but sales began to falter in 2005, as soon as promotional support was reduced. During 20042006 sales dropped alarmingly, which led to multiple rounds of inventory write-downs. These in turn further eroded margins and led to operating losses. By the end of 2006, the line was considered all but dead and Mercury's managers were not eager to try the experiment again. Valuing Mercury Athletic To perform a preliminary valuation, Liedtke developed a base case set of financial projections based on forecasts of revenue and operating income for each of Mercury's four main segments as shown in Exhibit 6. Liedtke's base case assumed that women's casual footwear would be wound down within one year following an acquisition, as he doubted that WCF would be willing to sell Mercury without it. He further assumed that Mercury's historical corporate overhead-to-revenue ratio would conform to historical averages. To accompany the operating projections, Liedtke prepared projections for certain balance sheet accounts for Mercury, shown in Exhibit 7; these corresponded to operating assets and liabilities that Liedtke expected would be required to support his operating projections. He did not prepare projections for debt or equity accounts since Mercury likely would not have its own balance sheet and capital structure following an acquisition by AGI. To estimate a discount rate, Liedtke planned to assume the same degree of leverage for Mercury that AGI currently used, which he estimated to be 20%, measured as debt divided by the market value of AGI's invested capital. Given current credit market conditions, he expected this degree of leverage to imply a cost of debt of 6.0%. Finally, his analysis would assume a 40% tax rate, equal to AGI's anticipated marginal tax rate. After examining Mercury's value using the base case assumptions, Liedtke also wanted to consider the value of possible synergies. Specifically, he believed that AGI's inventory management system could be adopted by Mercury at little incremental cost and would reduce Mercury's DSI to the same level as AGI's. In addition, he thought it was possible that Mercury's women's casual footwear line could be folded into Active Gear's, rather than discontinued. In that case, he thought the combined businesses could achieve an EBIT margin of 9% and revenue growth of 3%. I Exhibit 1 Active Gear, Inc. Historical Income Statements, years ended December 31 ($ in thousands) 2004 2005 2006 Operating Results: Revenue Less: Cost of Goods Sold Gross Profit Less: Selling Expenses Less: General & Administrative Expenses EBITDA Less: Depreciation & Amortization EBIT Net Interest Expense Less: Other, net EBT Less: Taxes Net Income $ 450,174 223,617 226,557 127,705 31.437 67,415 2.049 60,367 5,092 1.211 54,064 19.192 $ 34,872 $469,704 231.583 238,121 130,242 33.938 73,942 7343 66,599 5,143 (752) 62,208 21.089 $ 41,120 $ 470,286 234,494 235,792 130,471 36.535 68,786 8,366 60,420 5,098 24 55,298 19,349 $ 35,949 Margins: Revenue Growth Gross Profit Margin EBITDA Margin EBIT Margin EBT Margin Tax Rate Net Income Margin 1.7% 50.3% 15.0% 13.4% 12.0% 35.5% 7.7% 4.3% 50.7% 15.7% 14.2% 13.2% 33.9% 8.8% 0.1% 50.1% 14.6% 12.8% 11.8% 35.0% 7.6% Exhibit 2 Active Gear, Inc. Historical Balance Sheets, at December 31 ($ in thousands) 2004 2005 2006 Assets: Cash & Cash Equivalents Accounts Receivable Inventory Prepaid Expenses Deferred Taxes Derivative Assets Total Current Assets $ 92,735 46,507 38,493 8,298 8,681 $ 63,949 50,649 50,140 10,051 8,080 1.813 184,682 $ 54,509 61,322 56,030 12,223 6,519 53 190,655 194,714 Property, Plant & Equipment Intangible Assets Goodwill Other Assets Total Assets 23,694 6,414 4,249 2.982 $ 232,053 24,712 12,273 11,851 3,072 $ 236,596 28,392 14,360 11,915 3.249 $ 248,571 Liabilities & Owners' Equity: Accounts Payable Accrued Expenses Taxes Payable Derivative Liabilities Other Total Current Liabilities $ 15,711 37,211 10,421 0 4.514 $ 67,858 $ 29,188 30,553 13,263 0 0 $ 73,004 $ 33,009 36,718 10,162 0 878 $ 80,767 Long Term Debt Deferred Compensation Deferred Taxes 178,173 3,763 2,180 150,240 4,814 323 140,047 3,919 0 Total Owners' Equity Total Liabilities & Owners' Equity (19.921) $ 232,053 8.216 $ 236,596 23,837 $ 248,571 Exhibit 3 Selected Data on Public Footwear Companies, March 15, 2007, except as noted (non-ratio alues in $ in thousands) Company D&B Shoe Company Marina Wilderness General Shoe Corp. Kinsley Coulter Products Victory Athletic Surfside Footwear Alpine Company Heartland Outdoor Footwear Templeton Athletic Average Equity Market Value 420,098 1,205,795 533,463 165,560 35,303,250 570,684 1,056,033 1,454,875 397,709 Net Debt (1) 125,442 (91,559) 171,835 82,236 7,653,207 195,540 300,550 (97,018) 169,579 D/E 29.9% -7.6% 32.2% 49.7% 21.7% 34.3% 28.5% -6.7% 42.6% 24.9% Equity Beta 2.68 1.94 1.92 1.12 0.97 2.13 1.27 1.01 0.98 LTM Revenue 2,545,058 313,556 1,322,392 552,594 15,403,547 1,241,529 1,614,648 1,176,144 516,182 LTM Earnings 67,679 41,923 64,567 27,568 1,433,760 73,124 112,015 86,156 79,170 Revenue CAGR 2000-06 6.6% 17.8% 11.2% 4.6% 7.9% 10.1% 6.2% 8.5% 14.4% 9.7% Company D&B Shoe Company Marina Wilderness General Shoe Corp Kinsley Coulter Products Victory Athletic Surfside Footwear Alpine Company Heartland Outdoor Footwear Templeton Athletic Average EBIT Margin 4.4% 22.1% 8.8% 6.9% 14.1% 9.3% 10.4% 10.8% 19.9% 11.9% EBITDA Margin 6.1% 23.1% 11.5% 8.9% 16.0% 10.8% 12.2% 12.6% 20.2% 13.5% Net Inc. Margin 2.7% 13.4% 4.9% 5.0% 9.3% 5.9% 6.9% 7.3% 15.3% 7.9% EBIT Multiple 5.5x 18.0x 6.8x 7.3x 22.1x 7.4x 9.0x 12.0x EBITDA Multiple 3.9x 16.9x 5.1x 5.5x 19.2x 6.3x 7.6x 10.1x 6.0x 9.0x P/E Multiple 6.8x 31.6x 9.1x 6.6x 27.1x 8.6x 10.4x 18.6x 5.5x 13.8x B/V Multiple 0.9x 6.0x 1.6x 0.7x 6.Ox 1.4x 2.0x 3.1x 1.2x 2.5x 10.5x (1) Net debt is defined as Debt less cash & cash equivalents Note: Market multiples are based on three year averages. "LTM" denotes latest twelve months. Exhibit 4 Mercury Athletic Footwear Historical Financial Statements ($ in thousands) Operating Results: 2004 2005 2006 Net Revenue $ 340,578 $ 358,780 $ 431,121 Less: Cost of Goods Sold 198.115 205,820 239.383 Gross Profit 142,463 152,960 191,738 Less: Selling, General & Administrative 102.410 113,892 139.933 EBITDA 40,053 39,067 51,804 Less: Depreciation & Amortization 2699 8.001 2.506 EBIT 32,353 31,066 42,299 Less: Corporate Administrative Charge 3.05 366 EBT 32,079 30,761 41,933 Less: Taxes 12.190 11.689 15.934 Net Income $ 19,889 $ 19,072 $ 25,998 275 Assets: Cash & Cash Equivalents Accounts Receivable Inventory Prepaid Expenses Total Current Assets 2004 $ 12,203 29,115 53,552 7802 102,679 2005 $ 20,187 38,654 70,818 15,810 145,470 2006 $ 10,676 45,910 73,149 10.172 139,908 Property, Plant & Equipment Trademarks & Other Intangibles Goodwill Other Assets Total Assets 33,090 1,031 554 5.657 $ 143,011 31,334 35,740 34,605 11.884 $ 259,032 32,618 43,853 43,051 11.162 $ 270,592 Liabilities & Owners' Equity: Accounts Payable Accrued Expenses Total Current Liabilities $ 12,838 13.040 25,878 $ 14,753 21.955 36,708 $ 16,981 18.810 35,791 Deferred Taxes Pension Obligation 1,635 8,131 13,795 9,256 11,654 9,080 Owners' Equity Total Liabilities & Owners' Equity 107 367 $ 143,011 199.274 $ 259,032 214.067 $ 270,592 Exhibit 5 Mercury Athletic Footwear Segment Data, 2004-2006 ($ in thousands) Men's Men's Women's Women's Unallocated Fiscal Year 2006: Athletic Casual Athletic Casual Corporate Revenue $ 219,093 51,663 123,563 36,802 0 Operating Income 31,421 8,242 12,703 (843) (9,224) Total Assets $ 148,576 28,457 27,978 34,701 30,880 Consolidated 431,121 42,299 270,592 Fiscal Year 2005 Revenue Operating Income Total Assets $ 151,900 18,398 $ 173,482 55,402 9,077 30,842 108,097 11,631 24,267 43,381 (1,013) 12,197 0 (7,027) 18,244 358,780 31,066 259,032 Fiscal Year 2004: Revenue Operating Income Total Assets $ 131,636 17,720 $ 39,543 58,787 9,196 34,966 95,897 9,109 22,526 54,258 462 15,056 0 (4,134) 30,919 340,578 32,353 143,011 2006 EBIT Margins 2005 EBIT Margins 2004 EBIT Margins Men's Athletic 14.3% 12.1% 13.5% Men's Casual 16.0% 16.4% 15.6% Women's Athletic 10.3% 10.8% 9.5% Women's Casual -2.3% -2.3% 0.9% Unallocated Corporate -2.1% -2.0% -1.2% Consolidated 9.8% 8.7% 9.5% Exhibit 6 Mercury Athletic Footwear: Base Case Projected Segment Performance ($ in thousands) Men's Athletic 2007 2008 2009 2010 2011 Revenue $ 251,957 $ 282,192 $ 310,411 $ 335,244 $ 352,006 Less: Operating Expenses 218,435 244.647 269,112 290.641 305.173 Operating Income 33,522 37,545 41,299 44,603 46,834 Men's Casual: Revenue Less: Operating Expenses Operating Income 52,179 43.834 8,345 53,223 44.711 8,512 54,287 45,605 8,682 55,916 46.973 8,943 57,594 48.382 9,211 138,390 124.302 14,088 153,613 137.976 15,638 167,438 150,393 17,045 179,159 160.921 18,238 188,117 168.967 19,150 Women's Athletic Revenue Less: Operating Expenses Operating Income Women's Casual Revenue Less: Operating Expenses Operating Income 0 36,802 37265 (463) 090 0 9 0 0 0 0 Consolidated Revenue Less: Operating Expenses Less: Corporate Overhead Consolidated Operating Income 479,329 423,837 8,487 $ 47,005 489,028 427,333 8.659 $ 53,036 532,137 465,110 9,422 $ 57,605 570,319 498,535 10,098 $ 61,686 597,717 522,522 10583 $ 64,612 Estimated Capital Expenditures Estimated Depreciation 11,983 9,587 12,226 9,781 13,303 10,643 14,258 11,406 14,943 11,954 2 * Operating Expenses include an allocation of depreciation for each segment. Exhibit 7 Mercury Athletic Footwear: Projection of Selected Balance Sheet Accounts; 2007-2011 ($ in thousands) 2007 2008 2009 2010 2011 Selected Balance Sheet Accounts:. Assets Cash Used in Operations Accounts Receivable Inventory Prepaid Expenses $ 4,161 47,888 83,770 14,474 $ 4,195 48,857 85,465 14,767 $ 4,566 53,164 92,999 16,069 $ 4,894 56,978 99,672 17,222 $ 5,130 59,715 104,460 18,049 Property, Plant & Equipment Trademarks & Other Intangibles Goodwill Other Assets 35,015 43,853 43,051 11,162 37,460 43,853 43,051 11,162 40,120 43,853 43,051 11,162 42,972 43,853 43,051 11,162 45,961 43,853 43,051 11,162 Liabilities Accounts Payable Accrued Expenses $ 18,830 22,778 $ 18,985 22,966 $ 20,664 24,996 $ 22,149 26,792 $ 23,214 28,081 Deferred Taxes Pension Obligation 11,654 9,080 11,654 9,080 11,654 9,080 11,654 9,080 11,654 9,080