

Question: 1. Is Sun Microsystems a good strategic fit for Oracle?, explain 2. Using a discounted cash flow valuation: a What rate of return should Oracle
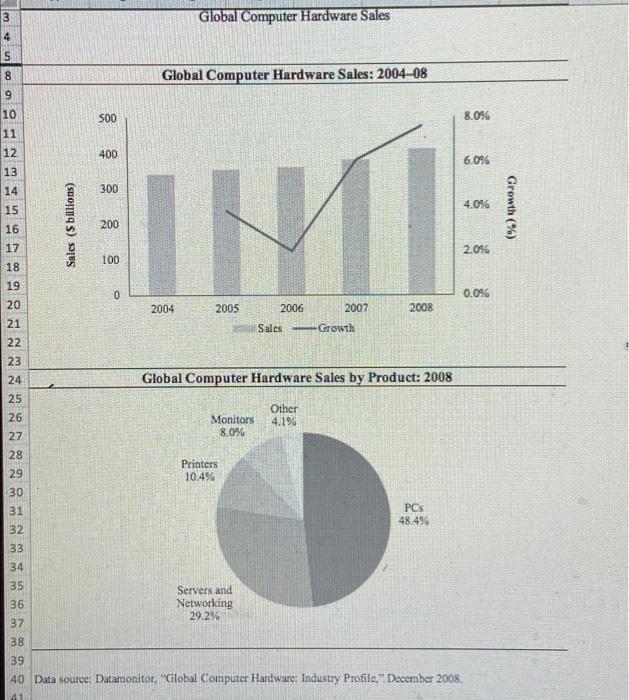
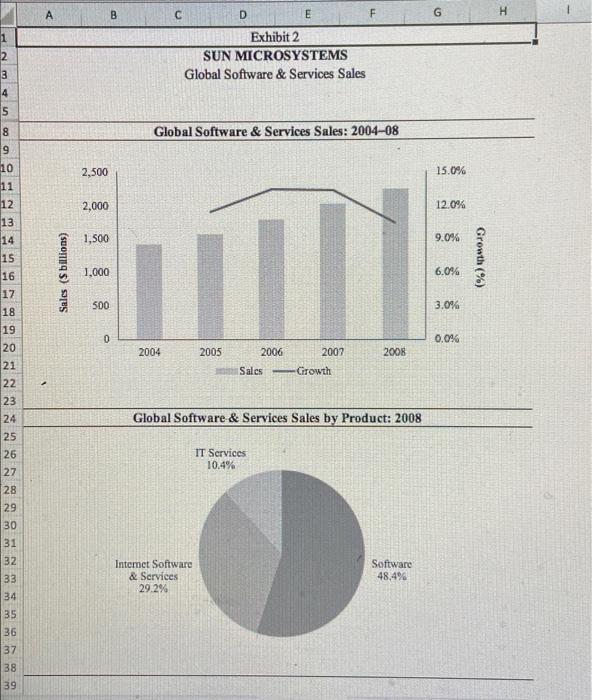
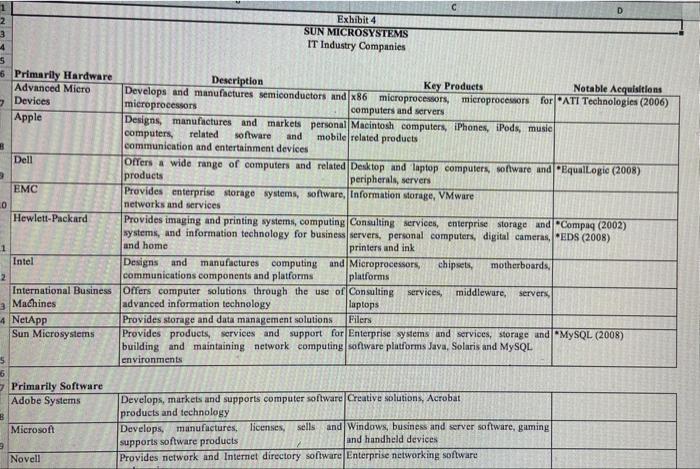
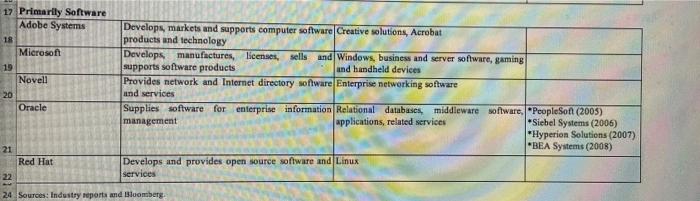
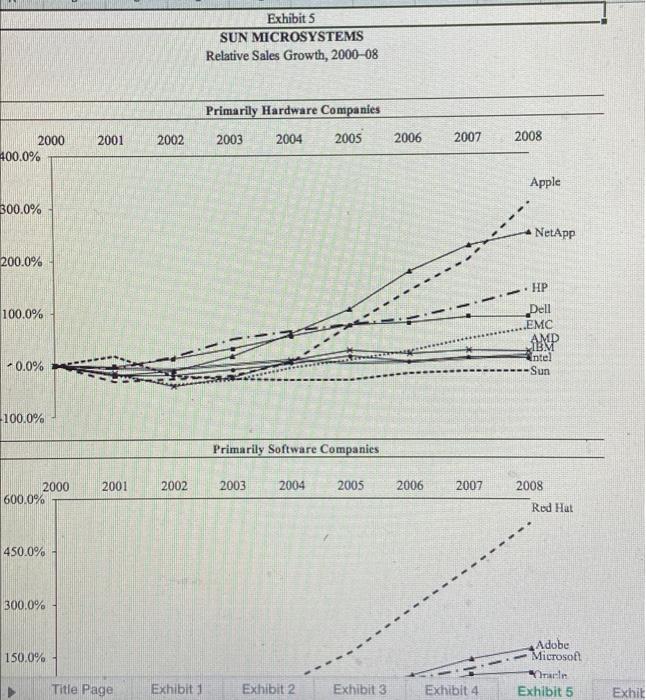
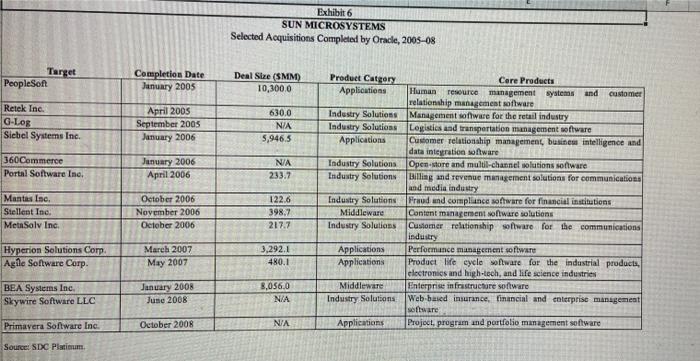
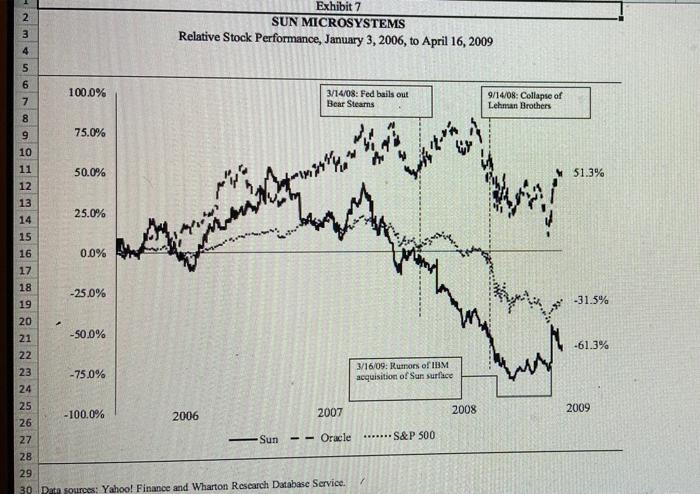
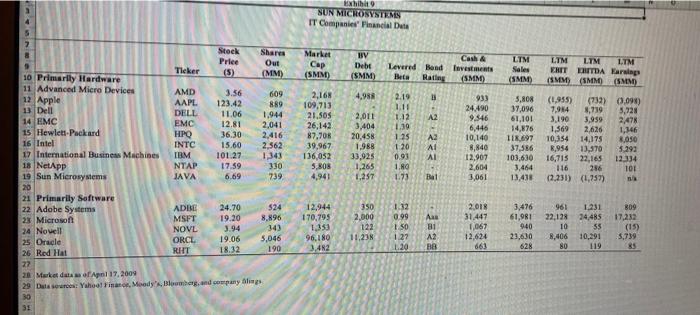
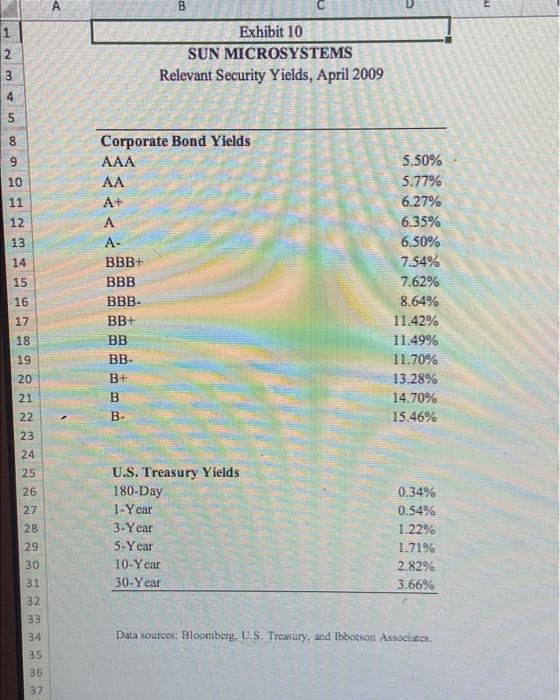
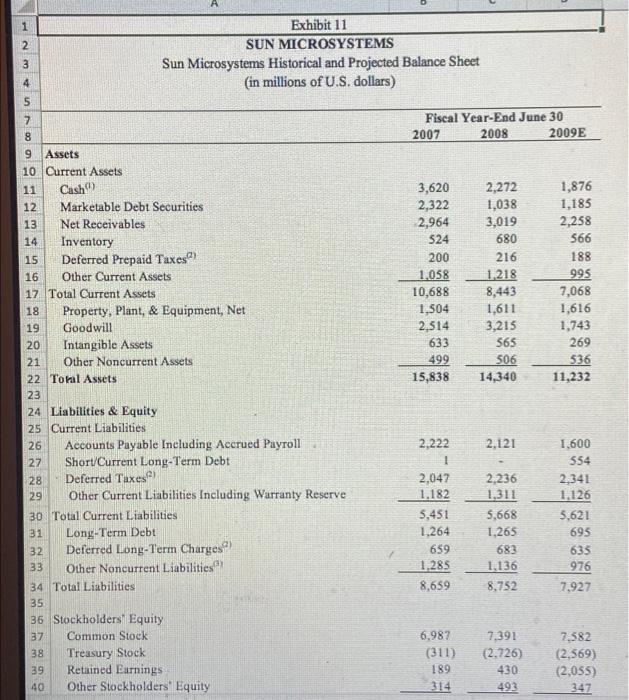
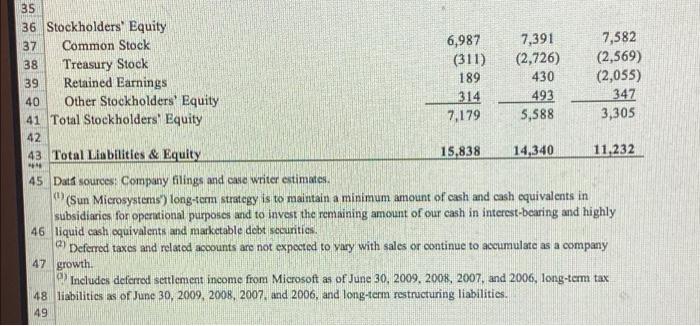
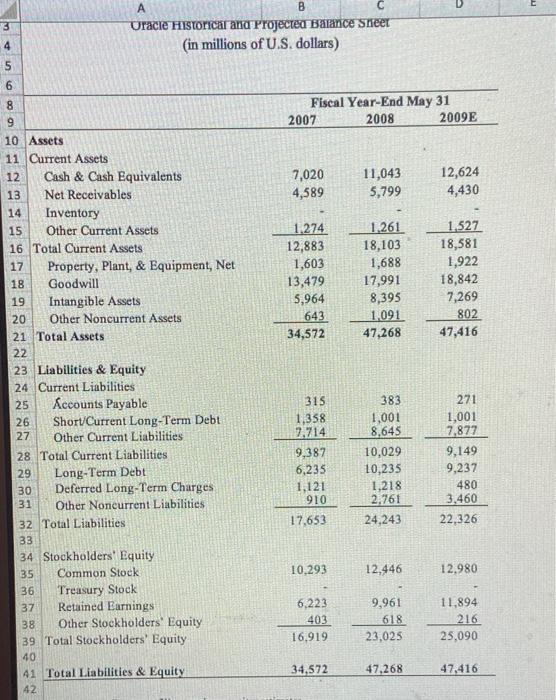
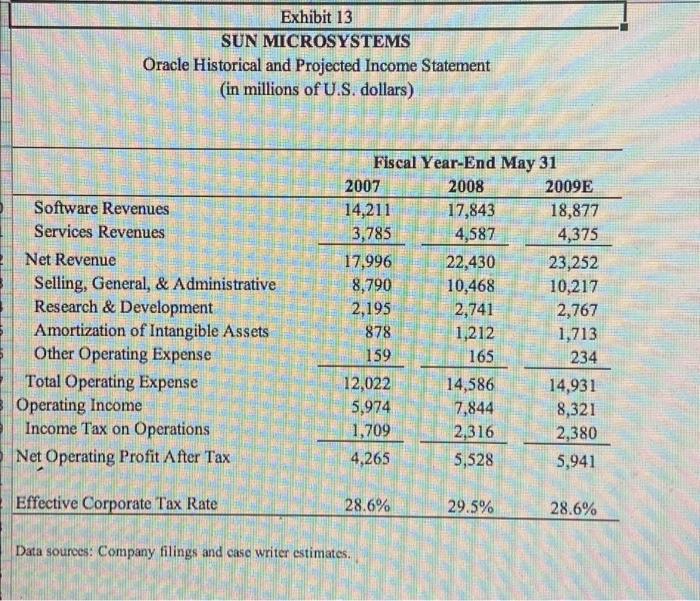
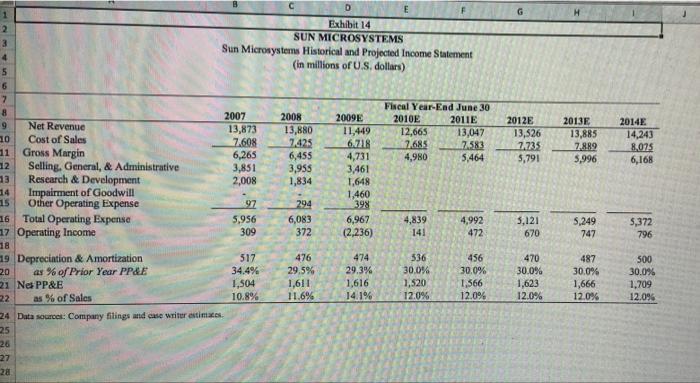
1. Is Sun Microsystems a good strategic fit for Oracle?, explain 2. Using a discounted cash flow valuation: a What rate of return should Oracle require on the acquisition? b. What base-case cash flows do you forecast? c. What is your estimate of terminal value? d. Without the synergies: What is the enterprise value of Sun Microsystems? What is the equity value? 3. Identify the synergies and conduct a sensitivity analysis to estimate the enterprise value and equity value of Sun Microsystems with the effects of the synergies. 3 Global Computer Hardware Sales cou w 8 Global Computer Hardware Sales: 2004-08 9 500 8.096 10 11 12 400 un AW NO 6.096 13 14 300 4.0% 15 Sales (S billions) IH M 16 Growth (%) 200 17 2.0% 100 18 19 0 0.0% 20 2004 2005 2006 2002 2008 21 Sales Growth 22 23 24 Global Computer Hardware Sales by Product: 2008 25 26 Monitors 8.0% Other 4.1% 27 28 Printers 10.4% 29 30 31 PCS 48.4% 32 33 34 35 36 Servers and Networking 29.2% 37 38 39 40 Data source: Datamonitor. "Global Computer Hardware: Industry Profile." December 2008 B D E F G H 2 3 Exhibit 2 SUN MICROSYSTEMS Global Software & Services Sales 4 5 00 Global Software & Services Sales: 2004-08 2,500 15.0% 2,000 12.0% 9 10 11 12 13 14 15 16 17 1,500 9.0% Sales (S billions) Growth (%) 1.000 6.0% 500 3.0% 0 0.0% 2004 2005 2006 2007 2008 18 19 20 21 22 23 24 a GSN No a Sales-Growth - Global Software & Services Sales by Product: 2008 IT Services 10.4% 25 26 27 28 29 30 31 32 33 34 35 36 37 38 39 Internet Software & Services 29.2% Software 48,4% 2 Exhibit 4 3 SUN MICROSYSTEMS 4 IT Industry Companies 5 6 Primarily Hardware Description Advanced Micro Develops and manufactures semiconductors and x86 microprocessors, microprocessors for "ATI Technologies (2006) Key Products Notable Acquisitions Devices microprocessors computers and servers Apple Designs, manufactures and markets personal Macintosh computers, iPhones, iPods music computers, related software and mobile related products 3 communication and entertainment devices Dell Offers a wide range of computers and related Desktop and laptop computers, software and EqualLogic (2008) products peripherals, servers EMC Provides enterprise storage systems, software, Information storage, VMware 0 networks and services Hewlett-Packard Provides imaging and printing systems, computing Consulting services, enterprise storage and Compaq (2002) systems, and information technology for business servers, personal computers, digital cameras, EDS (2008) 1 and home printers and ink Intel Designs and manufactures computing and Microprocessors chipsets, motherboards, 2 communications components and platforms platforms International Business Offers computer solutions through the use of Consulting services, middleware, servers, 3 Machines advanced information technology laptops 4 NetApp Provides storage and data management solutions Filers Sun Microsystems Provides products, services and support for Enterprise systems and services, storage and "MySQL (2008) building and maintaining network computing software platforms Java, Solaris and MySQL 5 environments 5 Primarily Software Adobe Systems Develops, markets and supports computer software Creative solutions, Acrobat 3 products and technology Microsoft Develops manufactures, licenses, sells and Windows, business and server software, gaming supports software products and handheld devices 3 Novell Provides network and Internet directory software Enterprise networking software 17 Primarily Software Adobe Systems 18 Microsoft 19 Novell 20 Oracle Develops, markets and supports computer software Creative solutions, Acrobat products and technology Develops manufactures, licenses, sells and Windows, business and server software, gaming supports software products ind handheld devices Provides network and Internet directory software Enterprise networking software and services Supplies software for enterprise information Relational databases, middleware software. PeopleSoft (2005) management applications related services Siebel Systems (2006) *Hyperion Solutions (2007) "BEA Systems (2008) Develops and provides open source software and Linux services 21 Red Hat 22 24 Sources: Industry reports and Bloomberg Exhibit 5 SUN MICROSYSTEMS Relative Sales Growth, 2000-08 Primarily Hardware Companies 2003 2004 2005 2001 2002 2006 2007 2008 2000 400.0% Apple 300.0% NetApp 200.0% HP 100.0% Dell EMC AMP IBM Intel - 0.0% -Sun 100.0% Primarily Software Companies 2001 2002 2003 2004 2005 2006 2007 2008 2000 600.0% Red Hat 450.0% 300.0% Adobe Microsoft 150.0% Title Page Exhibit 1 Exhibit 2 Exhibit 3 Exhibit 4 Exhibit 5 Exhit Exhibit 6 SUN MICROSYSTEMS Selected Acquisitions Completed by Oracle, 2005-08 Target Peopleson Completion Date January 2005 Deal Size (SMM) 10,300.0 Retek Inc. G-Log Siebel Systems Inc. April 2005 September 2005 January 2006 630.0 N/A 5,946,5 360 Commerce Portal Software Ine, January 2006 April 2006 NA 233.7 Mantas Inc. Stellent Inc. MetnSolv Inc. October 2006 November 2006 October 2006 122.6 398,7 217.7 Product Catgory Core Products Applications Human resource management systems and customer relationship management Software Industry Solutions Management software for the retail industry Industry Solutions Logistics and transportation management software Applications Customer relationship management, business Intelligence and data integration software Industry Solutions Open-store and multi-channel solutions software Industry Solutions Billing and revenue management solutions for communications and media industry Industry Solutions Fraud and compliance software for financial institutions Middleware Content management software solutions Industry Solutions Customer relationship software for the communications industry Applications Performance management software Applications Product life cycle software for the industrial products, electronics and high-tech, and life science industries Middleware Enterprise infrastructure software Industry Solutions Web-based insurance, financial and enterprise management software Applications Project, program and portfolio management software Hyperion Solutions Corp Agile Software Corp. March 2007 May 2007 3,292.1 480.1 BEA Systems Inc Skywire Software LLC January 2008 June 2008 3,056.0 N/A October 2008 Primavera Software Inc. NA Source: SDXC Platinum Nm 2 3 4 5 Exhibit 7 SUN MICROSYSTEMS Relative Stock Performance, January 3, 2006, to April 16, 2009 6 100.0% 7 3/14/08: Fed bails out Bear Stearns 9/14/08: Collapse of Lehman Brothers 8 9 75.0% Son you int 50.0% 51.3% AN pro na may 25.0% 10 11 12 13 14 15 16 17 18 19 20 0.0% -25.0% -31.5% -50.0% -61.3% 21 22 23 24 25 -75.0% 3/16/09: Rumors of IBM acquisition of Sun surface -100.0% 2007 2008 2009 2006 26 ... S&P 500 co 27 Sun - - Oracle 28 29 30 Date sources: Yahoo! Finance and Wharton Research Database Service. NN 009 Exhibit SUN MICROSYSTEMS IT Companies Financial Data Share Out (MM) Market Cap (SMM) BV Debt (SMM) Levered Band Beca Rating Cash Investments (SMM LIM Sales LTM LIM LIM ERIT KRITDA Earnings (SMM (SMM (SMM) (SMM) 4,988 2.19 . A2 609 889 1.944 2,041 2,416 2,562 1,343 330 2,168 109,713 21.505 26,142 87,708 39,967 136,052 5.808 4,941 A2 Stock Prlee Tieker () 10 Primarily Hardware 11 Advanced Micro Devices AMD 3.56 12 Apple AAPL. 123.42 13 Dell DELL 11.06 14 EMC EMC 12.81 15 Hewlett-Packard HPO 36.30 16 Intel INTC 15.60 17 International Business Machines IAM 101.27 18 NetApp NTAP 17.59 19 Sun Mierosystems JAVA 6.69 20 21 Primarily Software 22 Adobe Systems ADRE 24.70 23 Microso MSFT 19.20 NOVL 3.94 Novell 19.06 ORCL 25 Oracle 26 Red Hat RIT 18.32 22 20 Market data of Al 17, 2009 29 Dalar: Yahoo Fino Moody Bloomberg and company 30 2,011 3,404 20,458 1.988 33.925 1,265 1,257 1.11 1.12 1.39 1.25 1 20 0.93 1.80 1.73 933 24.490 9.546 6,446 10,140 8,840 12,907 2,604 3,061 5.808 37,096 61,101 14,876 118.697 37,586 103,630 3.464 13,438 (1,955) (732) 0.098) 7,914 4,719 5,728 3.190 3,959 2,478 1,569 2.626 1,346 10,354 14,175 8.050 1,954 13,370 5.292 16,715 22,165 12334 116 286 101 (7.231) (1,757) AI 739 Bat Aas 524 8.896 143 5,046 190 12,944 170,795 1.353 96,180 3.42 350 2,000 122 11.23 1.32 0.99 1.50 1.22 1.20 2018 31.447 1,067 12,624 663 3,476 61,981 940 21,630 B2E 961 1.231 22.128 24485 10 55 8,406 10,291 80 119 809 17,232 (15) 5,739 628 31 A B E 1 2 3 4 Exhibit 10 SUN MICROSYSTEMS Relevant Security Yields, April 2009 5 8 9 ON 10 11 12 1 . 1 13 14 15 16 Corporate Bond Yields AAA AA A+ A A- BBB+ BBB BBB- BB+ BB BB- B+ B B- 5.50% 5.77% 6.27% 6.35% 6.50% 7.54% 7.62% 8.64% 11.42% 11.49% 11.70% 13.28% 14.70% 15.46% 17 18 19 20 21 NNN 22 23 24 25 NNNNNN 26 27 28 29 30 31 32 33 34 U.S. Treasury Yields 180-Day 1-Year 3-Year 5-Year 10-Year 30-Year 0.34% 0.54% 1.22% 1.71% 2.82% 3.66% www SUN Data sources: Bloomberg, U.S. Treasury, and Ibbotson Associates 35 36 37 2 3 Exhibit 11 SUN MICROSYSTEMS Sun Microsystems Historical and Projected Balance Sheet (in millions of U.S. dollars) 4 5 7 8 Fiscal Year-End June 30 2007 2008 2009E 3,620 2,322 2,964 524 200 1,058 10,688 1,504 2,514 633 499 15,838 2,272 1,038 3,019 680 216 1.218 8,443 1,611 3,215 565 506 14,340 1,876 1,185 2,258 566 188 995 7,068 1,616 1,743 269 536 11,232 9 Assets 10 Current Assets 11 Cash) 12 Marketable Debt Securities 13 Net Receivables 14 Inventory 15 Deferred Prepaid Taxes) 16 Other Current Assets 17 Total Current Assets 18 Property, Plant, & Equipment, Net 19 Goodwill 20 Intangible Assets 21 Other Noncurrent Assets 22 Toral Assets 23 24 Liabilities & Equity 25 Current Liabilities 26 Accounts Payable Including Accrued Payroll 27 Short/Current Long-Term Debt Deferred Taxes 29 Other Current Liabilities Including Warranty Reserve 30 Total Current Liabilities 31 Long-Term Debt 32 Deferred Long-Term Charges 33 Other Noncurrent Liabilities 34 Total Liabilities 35 36 Stockholders Equity 37 Common Stock 38 Treasury Stock 39 Retained Earnings 40 Other Stockholders' Equity 2,121 28 2,222 1 2,047 1.182 5,451 1,264 659 1.285 8,659 2,236 1,311 5,668 1,265 683 1,136 N mmmmmmmmmm 1,600 554 2,341 1.126 5,621 695 635 976 7,927 8,752 O DOO 6,987 (311) 189 7,391 (2.726) 430 493 7.382 (2,569) (2,055) 347 314 35 36 Stockholders' Equity 37 Common Stock 6,987 7,391 7,582 38 Treasury Stock (311) (2,726) (2,569) 39 Retained Earnings 189 430 (2,055) 40 Other Stockholders' Equity 314 493 347 41 Total Stockholders Equity 7,179 5,588 3,305 42 43 Total Liabilities & Equity 15,838 14,340 11,232 45 Datf sources: Company filings and case writer estimates. (Sun Microsystems) long-term strategy is to maintain a minimum amount of cash and cash equivalents in subsidiaries for operational purposes and to invest the remaining amount of our cash in interest-bearing and highly 46 liquid cash oquivalents and marketable debt securities. 023 Deferred taxes and related accounts are not expected to vary with sales or continue to accumulate as a company 47 growth Includes deferred settlement income from Microsoft as of June 30, 2009, 2008, 2007. and 2006, long-term tax 48 liabilities as of June 30, 2009, 2008, 2007 and 2006, and long-term restructuring liabilities 49 E 13 B Uracle Historical and projected Barance Sheer (in millions of U.S. dollars) 4 un 5 6 Fiscal Year-End May 31 2007 2008 2009E 7,020 4,589 11,043 5,799 12,624 4,430 1.274 12,883 1,603 13,479 5,964 643 34,572 1.261 18,103 1,688 17,991 8,395 1.091 47,268 1.527 18,581 1,922 18,842 7,269 802 47,416 8 9 10 Assets 11 Current Assets 12 Cash & Cash Equivalents 13 Net Receivables 14 Inventory 15 Other Current Assets 16 Total Current Assets 17 Property, Plant, & Equipment, Net 18 Goodwill 19 Intangible Assets 20 Other Noncurrent Assets 21 Total Assets 22 23 Liabilities & Equity 24 Current Liabilities 25 Accounts Payable 26 Short/Current Long-Term Debt 27 Other Current Liabilities 28 Total Current Liabilities 29 Long-Term Debt 30 Deferred Long-Term Charges 31 Other Noncurrent Liabilities 32 Total Liabilities 33 34 Stockholders' Equity 35 Common Stock 36 Treasury Stock 37 Retained Earnings 38 Other Stockholders' Equity 39 Total Stockholders' Equity 40 41 Total Liabilities & Equity 42 ON NNNNNNNN 315 1,358 2,714 9,387 6,235 1.121 910 17,653 383 1,001 8,645 10,029 10,235 1,218 2.761 24,243 271 1,001 7,877 9,149 9,237 480 3,460 22,326 10,293 12.446 12,980 6,223 403 16,919 9,961 618 23,025 11,894 216 25,090 34,572 47,268 47,416 Exhibit 13 SUN MICROSYSTEMS Oracle Historical and Projected Income Statement (in millions of U.S. dollars) Software Revenues Services Revenues Net Revenue Selling, General, & Administrative Research & Development Amortization of Intangible Assets Other Operating Expense Total Operating Expense Operating Income Income Tax on Operations Net Operating Profit After Tax Fiscal Year-End May 31 2007 2008 2009E 14,211 17,843 18,877 3,785 4,587 4,375 17,996 22,430 23,252 8,790 10,468 10,217 2,195 2,741 2,767 878 1,212 1,713 159 165 234 12,022 14,586 14,931 5,974 7,844 8,321 1,709 2,316 2,380 4,265 5,528 5,941 Effective Corporate Tax Rate 28.6% 29.5% 28.6% Data sources: Company filings and case writer estimates. D 2012E 13,526 7.735 5,791 2013E 13,885 7.882 5,996 2014E 14,243 8,073 6,168 2 Exhibit 14 3 SUN MICROSYSTEMS Sun Microsysters Historical and Projected Income Statement 4 5 (in millions of U.S. dollars) 6 7 8 Fiscal Year-End June 30 2007 2008 2009E 2010E 9 2011E Net Revenue 13,873 13,880 11,449 12,665 13,047 10 Cost of Sales 7.608 7,425 6.718 7.685 7583 11 Gross Margin 6,265 6,455 4,731 4,980 5,464 12 Selling. General, & Administrative 3,851 3,955 3.461 3 Research & Development 2,008 1,834 1.648 14 Impairment of Goodwill 1,460 15 Other Operating Expense 97 16 Total Operating Expense 5,956 6,083 6,967 4,839 4,992 17 Operating Income 309 372 (2,236) 141 472 18 29 Depreciation & Amortization 517 476 474 536 456 20 as % of Prior Year PP&E 34.4% 29.5% 29.3% 30.0% 30.0% 21 No PP&E 1,504 1,611 1,616 1,520 1,566 22 as % of Sales 10.8% 11.6% 14.1% 12.0% 12.0 24 Data sources Company filings and case writer estimates 25 26 27 28 294 398 3,121 670 5,249 747 5,372 796 487 470 30.0% 1.623 12.0% 30.0% 1,666 12.0% 500 30.0% 1,709 12.096 1. Is Sun Microsystems a good strategic fit for Oracle?, explain 2. Using a discounted cash flow valuation: a What rate of return should Oracle require on the acquisition? b. What base-case cash flows do you forecast? c. What is your estimate of terminal value? d. Without the synergies: What is the enterprise value of Sun Microsystems? What is the equity value? 3. Identify the synergies and conduct a sensitivity analysis to estimate the enterprise value and equity value of Sun Microsystems with the effects of the synergies. 3 Global Computer Hardware Sales cou w 8 Global Computer Hardware Sales: 2004-08 9 500 8.096 10 11 12 400 un AW NO 6.096 13 14 300 4.0% 15 Sales (S billions) IH M 16 Growth (%) 200 17 2.0% 100 18 19 0 0.0% 20 2004 2005 2006 2002 2008 21 Sales Growth 22 23 24 Global Computer Hardware Sales by Product: 2008 25 26 Monitors 8.0% Other 4.1% 27 28 Printers 10.4% 29 30 31 PCS 48.4% 32 33 34 35 36 Servers and Networking 29.2% 37 38 39 40 Data source: Datamonitor. "Global Computer Hardware: Industry Profile." December 2008 B D E F G H 2 3 Exhibit 2 SUN MICROSYSTEMS Global Software & Services Sales 4 5 00 Global Software & Services Sales: 2004-08 2,500 15.0% 2,000 12.0% 9 10 11 12 13 14 15 16 17 1,500 9.0% Sales (S billions) Growth (%) 1.000 6.0% 500 3.0% 0 0.0% 2004 2005 2006 2007 2008 18 19 20 21 22 23 24 a GSN No a Sales-Growth - Global Software & Services Sales by Product: 2008 IT Services 10.4% 25 26 27 28 29 30 31 32 33 34 35 36 37 38 39 Internet Software & Services 29.2% Software 48,4% 2 Exhibit 4 3 SUN MICROSYSTEMS 4 IT Industry Companies 5 6 Primarily Hardware Description Advanced Micro Develops and manufactures semiconductors and x86 microprocessors, microprocessors for "ATI Technologies (2006) Key Products Notable Acquisitions Devices microprocessors computers and servers Apple Designs, manufactures and markets personal Macintosh computers, iPhones, iPods music computers, related software and mobile related products 3 communication and entertainment devices Dell Offers a wide range of computers and related Desktop and laptop computers, software and EqualLogic (2008) products peripherals, servers EMC Provides enterprise storage systems, software, Information storage, VMware 0 networks and services Hewlett-Packard Provides imaging and printing systems, computing Consulting services, enterprise storage and Compaq (2002) systems, and information technology for business servers, personal computers, digital cameras, EDS (2008) 1 and home printers and ink Intel Designs and manufactures computing and Microprocessors chipsets, motherboards, 2 communications components and platforms platforms International Business Offers computer solutions through the use of Consulting services, middleware, servers, 3 Machines advanced information technology laptops 4 NetApp Provides storage and data management solutions Filers Sun Microsystems Provides products, services and support for Enterprise systems and services, storage and "MySQL (2008) building and maintaining network computing software platforms Java, Solaris and MySQL 5 environments 5 Primarily Software Adobe Systems Develops, markets and supports computer software Creative solutions, Acrobat 3 products and technology Microsoft Develops manufactures, licenses, sells and Windows, business and server software, gaming supports software products and handheld devices 3 Novell Provides network and Internet directory software Enterprise networking software 17 Primarily Software Adobe Systems 18 Microsoft 19 Novell 20 Oracle Develops, markets and supports computer software Creative solutions, Acrobat products and technology Develops manufactures, licenses, sells and Windows, business and server software, gaming supports software products ind handheld devices Provides network and Internet directory software Enterprise networking software and services Supplies software for enterprise information Relational databases, middleware software. PeopleSoft (2005) management applications related services Siebel Systems (2006) *Hyperion Solutions (2007) "BEA Systems (2008) Develops and provides open source software and Linux services 21 Red Hat 22 24 Sources: Industry reports and Bloomberg Exhibit 5 SUN MICROSYSTEMS Relative Sales Growth, 2000-08 Primarily Hardware Companies 2003 2004 2005 2001 2002 2006 2007 2008 2000 400.0% Apple 300.0% NetApp 200.0% HP 100.0% Dell EMC AMP IBM Intel - 0.0% -Sun 100.0% Primarily Software Companies 2001 2002 2003 2004 2005 2006 2007 2008 2000 600.0% Red Hat 450.0% 300.0% Adobe Microsoft 150.0% Title Page Exhibit 1 Exhibit 2 Exhibit 3 Exhibit 4 Exhibit 5 Exhit Exhibit 6 SUN MICROSYSTEMS Selected Acquisitions Completed by Oracle, 2005-08 Target Peopleson Completion Date January 2005 Deal Size (SMM) 10,300.0 Retek Inc. G-Log Siebel Systems Inc. April 2005 September 2005 January 2006 630.0 N/A 5,946,5 360 Commerce Portal Software Ine, January 2006 April 2006 NA 233.7 Mantas Inc. Stellent Inc. MetnSolv Inc. October 2006 November 2006 October 2006 122.6 398,7 217.7 Product Catgory Core Products Applications Human resource management systems and customer relationship management Software Industry Solutions Management software for the retail industry Industry Solutions Logistics and transportation management software Applications Customer relationship management, business Intelligence and data integration software Industry Solutions Open-store and multi-channel solutions software Industry Solutions Billing and revenue management solutions for communications and media industry Industry Solutions Fraud and compliance software for financial institutions Middleware Content management software solutions Industry Solutions Customer relationship software for the communications industry Applications Performance management software Applications Product life cycle software for the industrial products, electronics and high-tech, and life science industries Middleware Enterprise infrastructure software Industry Solutions Web-based insurance, financial and enterprise management software Applications Project, program and portfolio management software Hyperion Solutions Corp Agile Software Corp. March 2007 May 2007 3,292.1 480.1 BEA Systems Inc Skywire Software LLC January 2008 June 2008 3,056.0 N/A October 2008 Primavera Software Inc. NA Source: SDXC Platinum Nm 2 3 4 5 Exhibit 7 SUN MICROSYSTEMS Relative Stock Performance, January 3, 2006, to April 16, 2009 6 100.0% 7 3/14/08: Fed bails out Bear Stearns 9/14/08: Collapse of Lehman Brothers 8 9 75.0% Son you int 50.0% 51.3% AN pro na may 25.0% 10 11 12 13 14 15 16 17 18 19 20 0.0% -25.0% -31.5% -50.0% -61.3% 21 22 23 24 25 -75.0% 3/16/09: Rumors of IBM acquisition of Sun surface -100.0% 2007 2008 2009 2006 26 ... S&P 500 co 27 Sun - - Oracle 28 29 30 Date sources: Yahoo! Finance and Wharton Research Database Service. NN 009 Exhibit SUN MICROSYSTEMS IT Companies Financial Data Share Out (MM) Market Cap (SMM) BV Debt (SMM) Levered Band Beca Rating Cash Investments (SMM LIM Sales LTM LIM LIM ERIT KRITDA Earnings (SMM (SMM (SMM) (SMM) 4,988 2.19 . A2 609 889 1.944 2,041 2,416 2,562 1,343 330 2,168 109,713 21.505 26,142 87,708 39,967 136,052 5.808 4,941 A2 Stock Prlee Tieker () 10 Primarily Hardware 11 Advanced Micro Devices AMD 3.56 12 Apple AAPL. 123.42 13 Dell DELL 11.06 14 EMC EMC 12.81 15 Hewlett-Packard HPO 36.30 16 Intel INTC 15.60 17 International Business Machines IAM 101.27 18 NetApp NTAP 17.59 19 Sun Mierosystems JAVA 6.69 20 21 Primarily Software 22 Adobe Systems ADRE 24.70 23 Microso MSFT 19.20 NOVL 3.94 Novell 19.06 ORCL 25 Oracle 26 Red Hat RIT 18.32 22 20 Market data of Al 17, 2009 29 Dalar: Yahoo Fino Moody Bloomberg and company 30 2,011 3,404 20,458 1.988 33.925 1,265 1,257 1.11 1.12 1.39 1.25 1 20 0.93 1.80 1.73 933 24.490 9.546 6,446 10,140 8,840 12,907 2,604 3,061 5.808 37,096 61,101 14,876 118.697 37,586 103,630 3.464 13,438 (1,955) (732) 0.098) 7,914 4,719 5,728 3.190 3,959 2,478 1,569 2.626 1,346 10,354 14,175 8.050 1,954 13,370 5.292 16,715 22,165 12334 116 286 101 (7.231) (1,757) AI 739 Bat Aas 524 8.896 143 5,046 190 12,944 170,795 1.353 96,180 3.42 350 2,000 122 11.23 1.32 0.99 1.50 1.22 1.20 2018 31.447 1,067 12,624 663 3,476 61,981 940 21,630 B2E 961 1.231 22.128 24485 10 55 8,406 10,291 80 119 809 17,232 (15) 5,739 628 31 A B E 1 2 3 4 Exhibit 10 SUN MICROSYSTEMS Relevant Security Yields, April 2009 5 8 9 ON 10 11 12 1 . 1 13 14 15 16 Corporate Bond Yields AAA AA A+ A A- BBB+ BBB BBB- BB+ BB BB- B+ B B- 5.50% 5.77% 6.27% 6.35% 6.50% 7.54% 7.62% 8.64% 11.42% 11.49% 11.70% 13.28% 14.70% 15.46% 17 18 19 20 21 NNN 22 23 24 25 NNNNNN 26 27 28 29 30 31 32 33 34 U.S. Treasury Yields 180-Day 1-Year 3-Year 5-Year 10-Year 30-Year 0.34% 0.54% 1.22% 1.71% 2.82% 3.66% www SUN Data sources: Bloomberg, U.S. Treasury, and Ibbotson Associates 35 36 37 2 3 Exhibit 11 SUN MICROSYSTEMS Sun Microsystems Historical and Projected Balance Sheet (in millions of U.S. dollars) 4 5 7 8 Fiscal Year-End June 30 2007 2008 2009E 3,620 2,322 2,964 524 200 1,058 10,688 1,504 2,514 633 499 15,838 2,272 1,038 3,019 680 216 1.218 8,443 1,611 3,215 565 506 14,340 1,876 1,185 2,258 566 188 995 7,068 1,616 1,743 269 536 11,232 9 Assets 10 Current Assets 11 Cash) 12 Marketable Debt Securities 13 Net Receivables 14 Inventory 15 Deferred Prepaid Taxes) 16 Other Current Assets 17 Total Current Assets 18 Property, Plant, & Equipment, Net 19 Goodwill 20 Intangible Assets 21 Other Noncurrent Assets 22 Toral Assets 23 24 Liabilities & Equity 25 Current Liabilities 26 Accounts Payable Including Accrued Payroll 27 Short/Current Long-Term Debt Deferred Taxes 29 Other Current Liabilities Including Warranty Reserve 30 Total Current Liabilities 31 Long-Term Debt 32 Deferred Long-Term Charges 33 Other Noncurrent Liabilities 34 Total Liabilities 35 36 Stockholders Equity 37 Common Stock 38 Treasury Stock 39 Retained Earnings 40 Other Stockholders' Equity 2,121 28 2,222 1 2,047 1.182 5,451 1,264 659 1.285 8,659 2,236 1,311 5,668 1,265 683 1,136 N mmmmmmmmmm 1,600 554 2,341 1.126 5,621 695 635 976 7,927 8,752 O DOO 6,987 (311) 189 7,391 (2.726) 430 493 7.382 (2,569) (2,055) 347 314 35 36 Stockholders' Equity 37 Common Stock 6,987 7,391 7,582 38 Treasury Stock (311) (2,726) (2,569) 39 Retained Earnings 189 430 (2,055) 40 Other Stockholders' Equity 314 493 347 41 Total Stockholders Equity 7,179 5,588 3,305 42 43 Total Liabilities & Equity 15,838 14,340 11,232 45 Datf sources: Company filings and case writer estimates. (Sun Microsystems) long-term strategy is to maintain a minimum amount of cash and cash equivalents in subsidiaries for operational purposes and to invest the remaining amount of our cash in interest-bearing and highly 46 liquid cash oquivalents and marketable debt securities. 023 Deferred taxes and related accounts are not expected to vary with sales or continue to accumulate as a company 47 growth Includes deferred settlement income from Microsoft as of June 30, 2009, 2008, 2007. and 2006, long-term tax 48 liabilities as of June 30, 2009, 2008, 2007 and 2006, and long-term restructuring liabilities 49 E 13 B Uracle Historical and projected Barance Sheer (in millions of U.S. dollars) 4 un 5 6 Fiscal Year-End May 31 2007 2008 2009E 7,020 4,589 11,043 5,799 12,624 4,430 1.274 12,883 1,603 13,479 5,964 643 34,572 1.261 18,103 1,688 17,991 8,395 1.091 47,268 1.527 18,581 1,922 18,842 7,269 802 47,416 8 9 10 Assets 11 Current Assets 12 Cash & Cash Equivalents 13 Net Receivables 14 Inventory 15 Other Current Assets 16 Total Current Assets 17 Property, Plant, & Equipment, Net 18 Goodwill 19 Intangible Assets 20 Other Noncurrent Assets 21 Total Assets 22 23 Liabilities & Equity 24 Current Liabilities 25 Accounts Payable 26 Short/Current Long-Term Debt 27 Other Current Liabilities 28 Total Current Liabilities 29 Long-Term Debt 30 Deferred Long-Term Charges 31 Other Noncurrent Liabilities 32 Total Liabilities 33 34 Stockholders' Equity 35 Common Stock 36 Treasury Stock 37 Retained Earnings 38 Other Stockholders' Equity 39 Total Stockholders' Equity 40 41 Total Liabilities & Equity 42 ON NNNNNNNN 315 1,358 2,714 9,387 6,235 1.121 910 17,653 383 1,001 8,645 10,029 10,235 1,218 2.761 24,243 271 1,001 7,877 9,149 9,237 480 3,460 22,326 10,293 12.446 12,980 6,223 403 16,919 9,961 618 23,025 11,894 216 25,090 34,572 47,268 47,416 Exhibit 13 SUN MICROSYSTEMS Oracle Historical and Projected Income Statement (in millions of U.S. dollars) Software Revenues Services Revenues Net Revenue Selling, General, & Administrative Research & Development Amortization of Intangible Assets Other Operating Expense Total Operating Expense Operating Income Income Tax on Operations Net Operating Profit After Tax Fiscal Year-End May 31 2007 2008 2009E 14,211 17,843 18,877 3,785 4,587 4,375 17,996 22,430 23,252 8,790 10,468 10,217 2,195 2,741 2,767 878 1,212 1,713 159 165 234 12,022 14,586 14,931 5,974 7,844 8,321 1,709 2,316 2,380 4,265 5,528 5,941 Effective Corporate Tax Rate 28.6% 29.5% 28.6% Data sources: Company filings and case writer estimates. D 2012E 13,526 7.735 5,791 2013E 13,885 7.882 5,996 2014E 14,243 8,073 6,168 2 Exhibit 14 3 SUN MICROSYSTEMS Sun Microsysters Historical and Projected Income Statement 4 5 (in millions of U.S. dollars) 6 7 8 Fiscal Year-End June 30 2007 2008 2009E 2010E 9 2011E Net Revenue 13,873 13,880 11,449 12,665 13,047 10 Cost of Sales 7.608 7,425 6.718 7.685 7583 11 Gross Margin 6,265 6,455 4,731 4,980 5,464 12 Selling. General, & Administrative 3,851 3,955 3.461 3 Research & Development 2,008 1,834 1.648 14 Impairment of Goodwill 1,460 15 Other Operating Expense 97 16 Total Operating Expense 5,956 6,083 6,967 4,839 4,992 17 Operating Income 309 372 (2,236) 141 472 18 29 Depreciation & Amortization 517 476 474 536 456 20 as % of Prior Year PP&E 34.4% 29.5% 29.3% 30.0% 30.0% 21 No PP&E 1,504 1,611 1,616 1,520 1,566 22 as % of Sales 10.8% 11.6% 14.1% 12.0% 12.0 24 Data sources Company filings and case writer estimates 25 26 27 28 294 398 3,121 670 5,249 747 5,372 796 487 470 30.0% 1.623 12.0% 30.0% 1,666 12.0% 500 30.0% 1,709 12.096
Step by Step Solution
There are 3 Steps involved in it

Get step-by-step solutions from verified subject matter experts