Question
1 Key Results NPV $1,048 IRR 13.79% MIRR 12.78% PI 1.10 Payback 3.39 Discounted payback 3.80 Explain the results for each of the viability criteria
1
Key Results | |
NPV | $1,048 |
IRR | 13.79% |
MIRR | 12.78% |
PI | 1.10 |
Payback | 3.39 |
Discounted payback | 3.80 |
Explain the results for each of the viability criteria shown above. Do not give a definition of NPV, and IRR, etc. Explain what the values mean. For example, what does it mean if a project has an NPV of $1,048? Etc.
Item | Meaning |
NPV | |
IRR | |
MIRR | |
PI | |
Payback Period | |
Discounted Payback Period |
QUESTION 2:
The core assumptions of the simulation is reflected in the table below. That is, key inputs are assumed to be generated in a certain way.
Inputs for Simulation Probability Distributions | Random Variables Used in Current Simulation Trial | ||||
Expected Value of Input | Standard Deviation of Input | Standard Normal Random Variable | Value Used in Current Trial | ||
Equipment cost | $7,750 | $354 | 1.49 | $8,277 | |
Salvage value, equipment, Year 4 | — | — | $639 | ||
Opportunity cost | — | — | $0 | ||
Externalities (cannibalization) | — | — | $0 | ||
Units sold, Year 1 | 10,000 | 1,061 | −0.89 | 9,053 | |
Annual change in units sold, after Year 1 | 15.00% | 7.07% | −0.98 | 8.09% | |
Sales price per unit, Year 1 | $1.50 | $0.18 | 2.07 | $1.87 | |
Annual change in sales price, after Year 1 | — | — | 4.00% | ||
Variable cost per unit (VC), Year 1 | $1.07 | $0.07 | 1.31 | $1.16 | |
Annual change in VC, after Year 1 | — | — | 3.00% | ||
Nonvariable cost (Non-VC), Year 1 | $2,120 | $148 | −0.71 | $2,015 | |
Annual change in Non-VC, after Year 1 | — | — | 3.00% | ||
Project WACC | — | — | 10.00% | ||
Tax rate | 40.00% | 7.07% | 0.07 | 40.51% | |
Working capital as % of next year's sales | — | — | 15.00% | ||
Assumed correlation between units sold in Year 1 and annual change in units sold in later years: | |||||
r = | 0.65 | ||||
- Discuss what assumption was made to cause the equipment cost to change from $7,750 to become $8,277 for ONE iteration. Hint: look at the calculation of $8,277 and explain how it was done.
- What caused the units sold to change from 10,000 units to 9,053?
QUESTION 3:
Assess the results of a simulation of 10,000 trials.
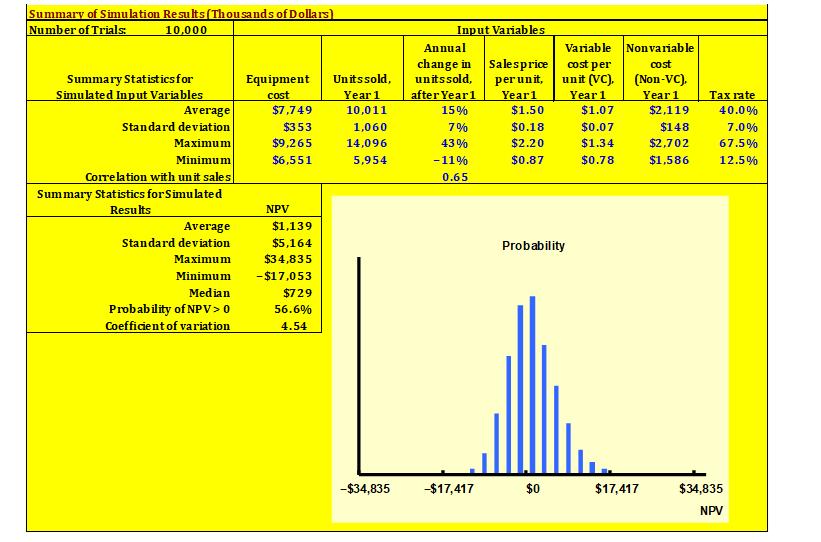
Put the checkmark in the box for 4b-Sim10000 and run the base situation as given in the worksheet from Took Kit for Chapter 11. Cut and paste ALL of the criteria (NPV, IRR, etc.) AND the graph, as shown below. (Everyone will get a different answer.)
Key Results Based on Current Trial | ||
NPV | $4,413 | |
IRR | 25.10% | |
MIRR | 19.83% | |
PI | 1.41 | |
Payback | 2.85 | |
Discounted payback | $3.24 | |

- That is, discuss each of simulated input values.
Item | Discussion |
Equipment cost | |
Units sold in Year 1 | |
Annual change in units sold after Year 1 | |
Sales price per unit, Year 1 | |
Variable cost per unit, Year 1 | |
Non-variable cost, Year 1 | |
Tax rate |
- Discuss the simulated output values (NPV, IRR, etc.)
Item | Discussion |
NPV | |
IRR | |
MIRR | |
PI | |
Payback Period | |
Discounted Payback Period |
- The simulated output was focused on NPV… Discuss each of the numbers (bottom part of the output table). Compare it with the base case above. Any surprises?
- Evaluate the probability graph and determine if you think that this a good project or not. Support your answer with the results found from the 10,000 simulations. Ensure that you state what values are on the x-axis and the y-axis. That is, your answer should be based on these two axes.
QUESTION 4:
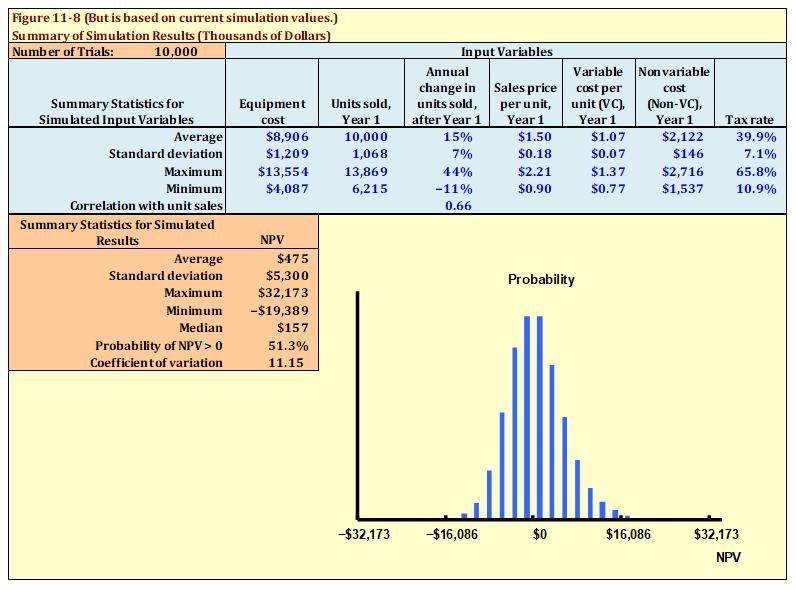
Suppose that the equipment cost went up by 15 percent, how would that impact the viability of the project. Please repeat exactly what you did for Numbers 1 and 2 above and summarize your results. Just compare the new results with the base results.
Base-Case result with new cost of equipment
Key Results | |
NPV | $273 |
IRR | 10.91% |
MIRR | 10.67% |
PI | 1.02 |
Payback | 3.48 |
Discounted payback | 3.95 |
Simulation with new cost of equipment.

Discuss your results here.
QUESTION 5:
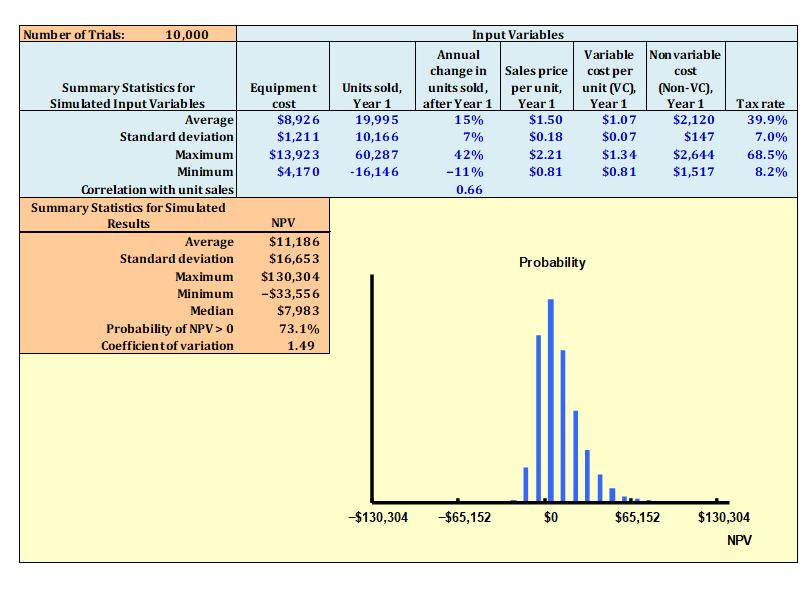
At the base-case spreadsheet, change the units of sale per year (10,000 units is the base amount) to find how many units must be sold per year to get an 90 percent probability of getting an NPV > 0. Use the Sim-10000 spreadsheet. Change the base-case unit sales until you get the Prob (NPV>0) = 90 %. Cut and paste your Summary of Simulation Results to show your answer. Is it feasible to increase sales units by this much?

I deliberately only gave you a picture for 73.1 %! Do the rest to get it to 90 %. Is this sales level reasonable?
QUESTION 6:
Simulations are projects done on paper! Many times!
- What are the major benefits of doing these viability simulations?
- What are the main criticisms of simulations? In this case, financial simulation
Summary of Simulation Results (Thousands of Dollars) Number of Trials: 10,000 Summary Statistics for Simulated Input Variables Average Standard deviation Maximum Minimum Correlation with unit sales Summary Statistics for Simulated Results Average Standard deviation Maximum Minimum Median Probability of NPV > 0 Coefficient of variation Equipment cost $7,749 $353 $9,265 $6,551 NPV $1,139 $5,164 $34,835 -$17,053 $729 56.6% 4.54 Units sold, Year 1 10,011 1,060 14,096 5,954 -$34,835 Input Variables Annual change in Salesprice units sold, per unit, Year1 after Year1 15% $1.50 7% $0.18 $2.20 $0.87 43% -11% 0.65 -$17,417 Variable cost per unit (VC), Year 1 Probability $0 $1.07 $0.07 $1.34 $0.78 Nonvariable cost (Non-VC), Year 1 $17,417 Tax rate 40.0% $2,119 $148 7.0% $2,702 67.5% $1,586 12.5% $34,835 NPV
Step by Step Solution
3.30 Rating (150 Votes )
There are 3 Steps involved in it
Step: 1
Question 1 Item NPV Meaning The NPV Net Present Value of 1048 indicates that the present value of the projects cash inflows exceeds the present value of its cash outflows by 1048 This suggests that th...
Get Instant Access to Expert-Tailored Solutions
See step-by-step solutions with expert insights and AI powered tools for academic success
Step: 2

Step: 3

Ace Your Homework with AI
Get the answers you need in no time with our AI-driven, step-by-step assistance
Get Started


