Answered step by step
Verified Expert Solution
Link Copied!

Question

1 Approved Answer

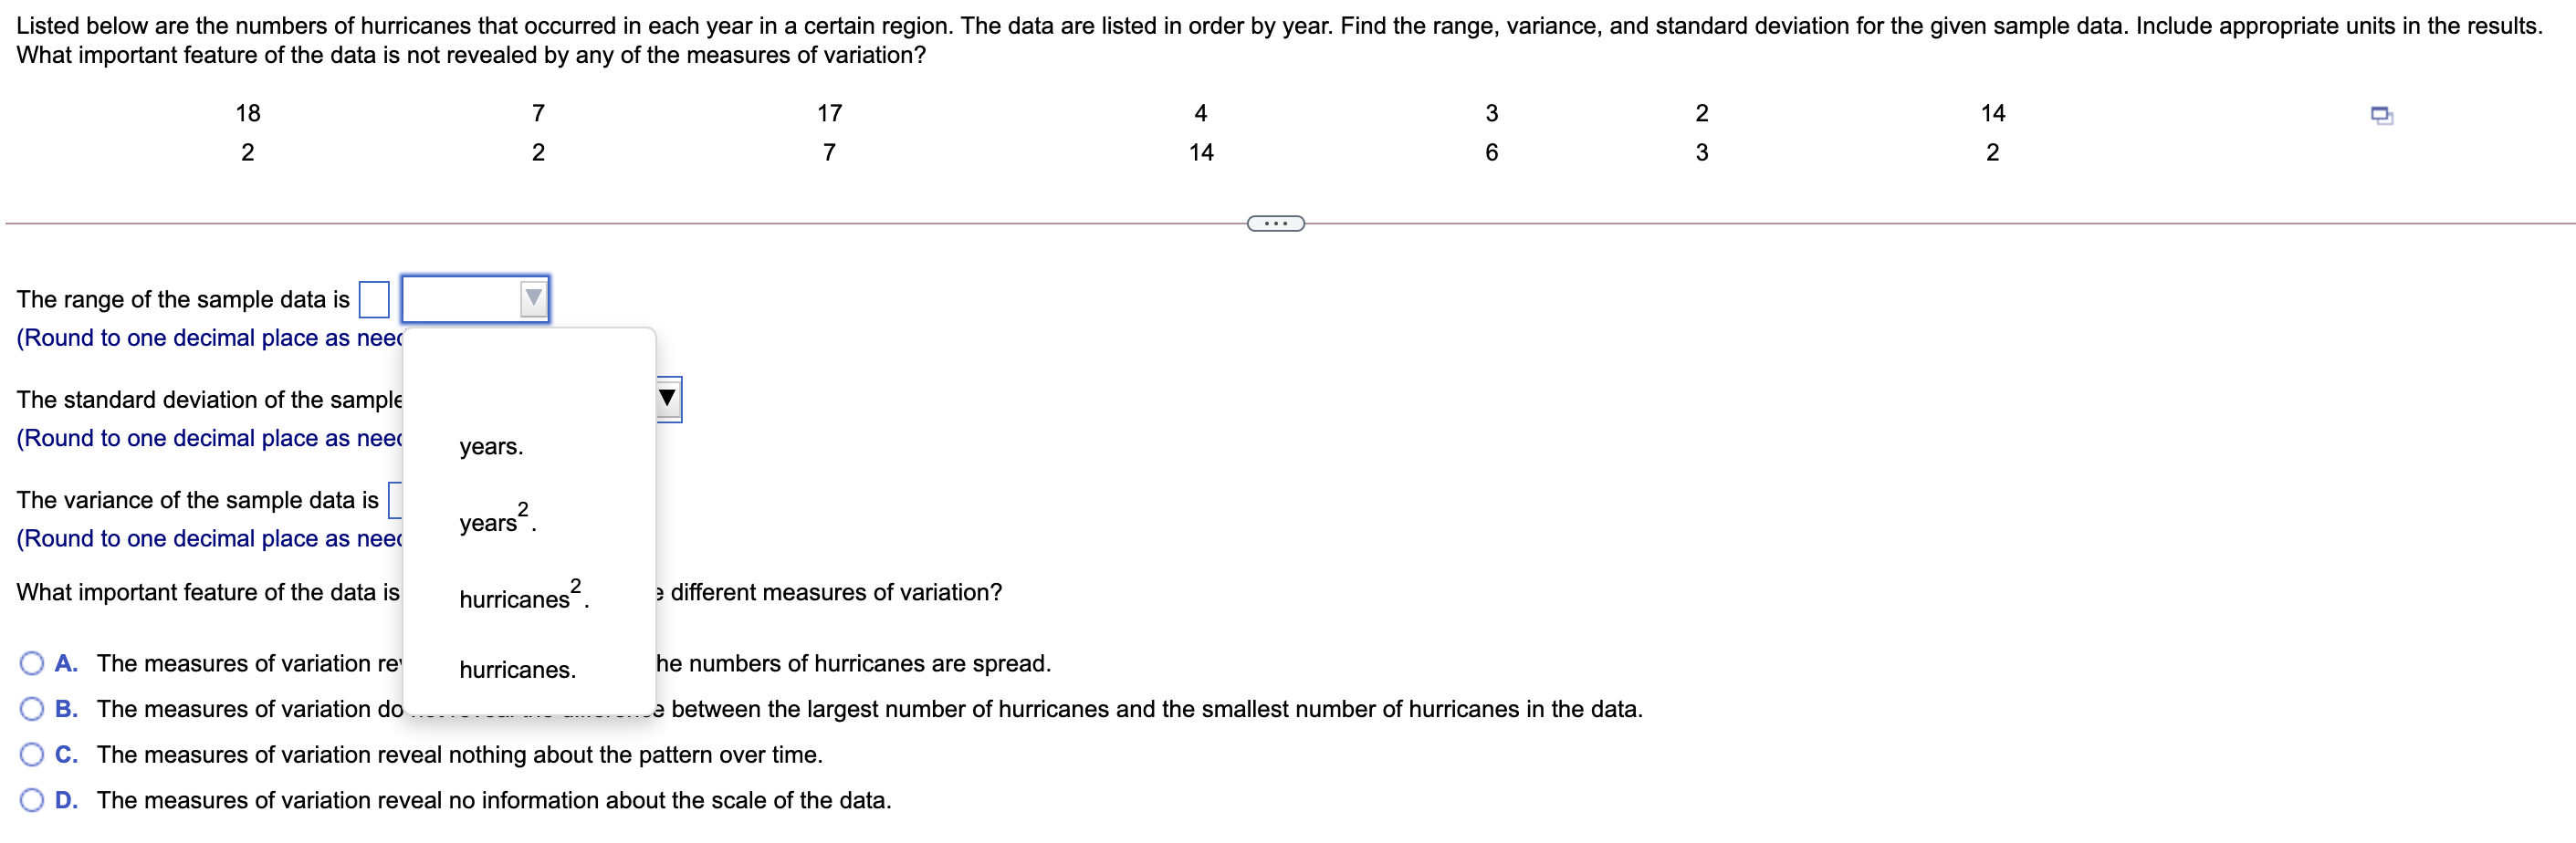
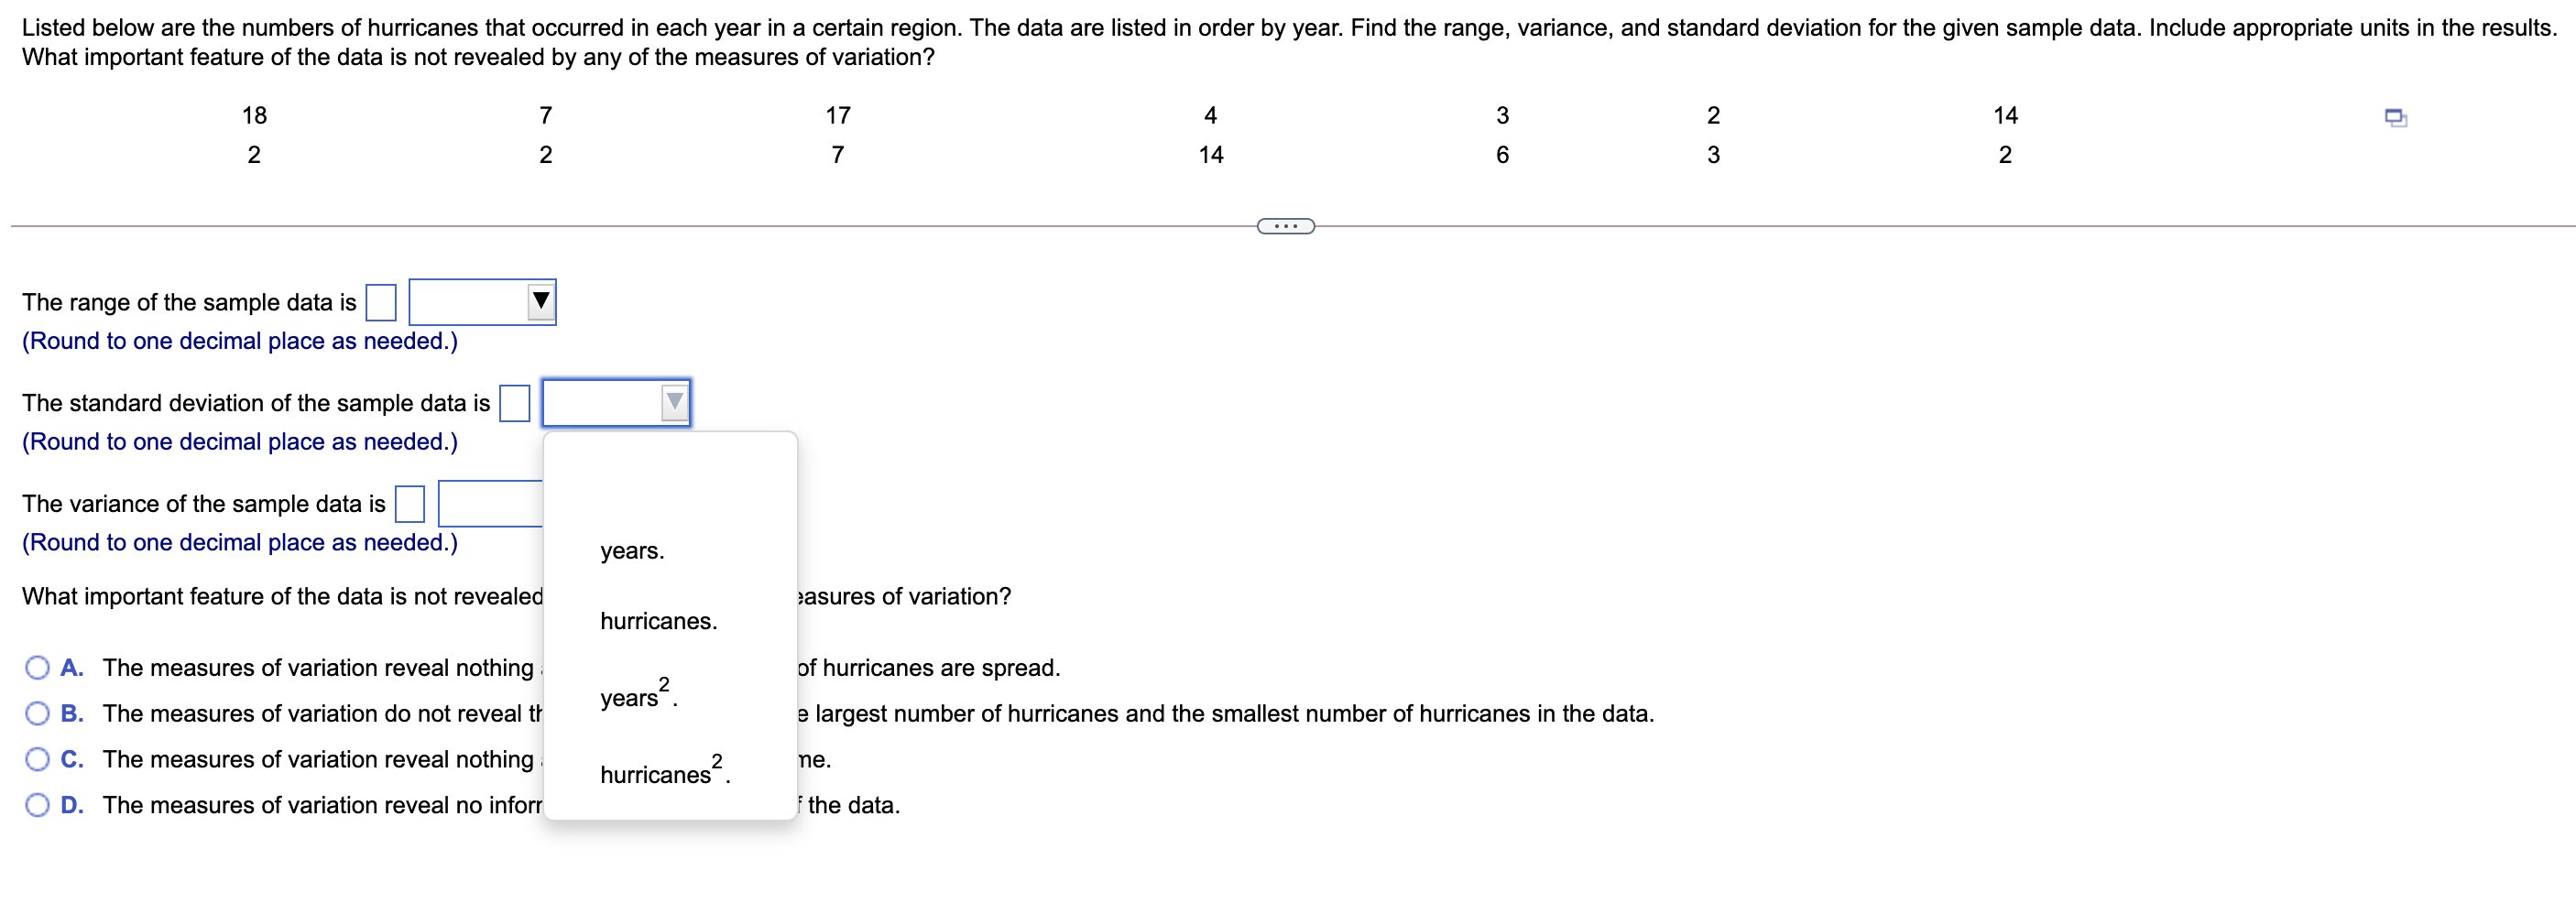
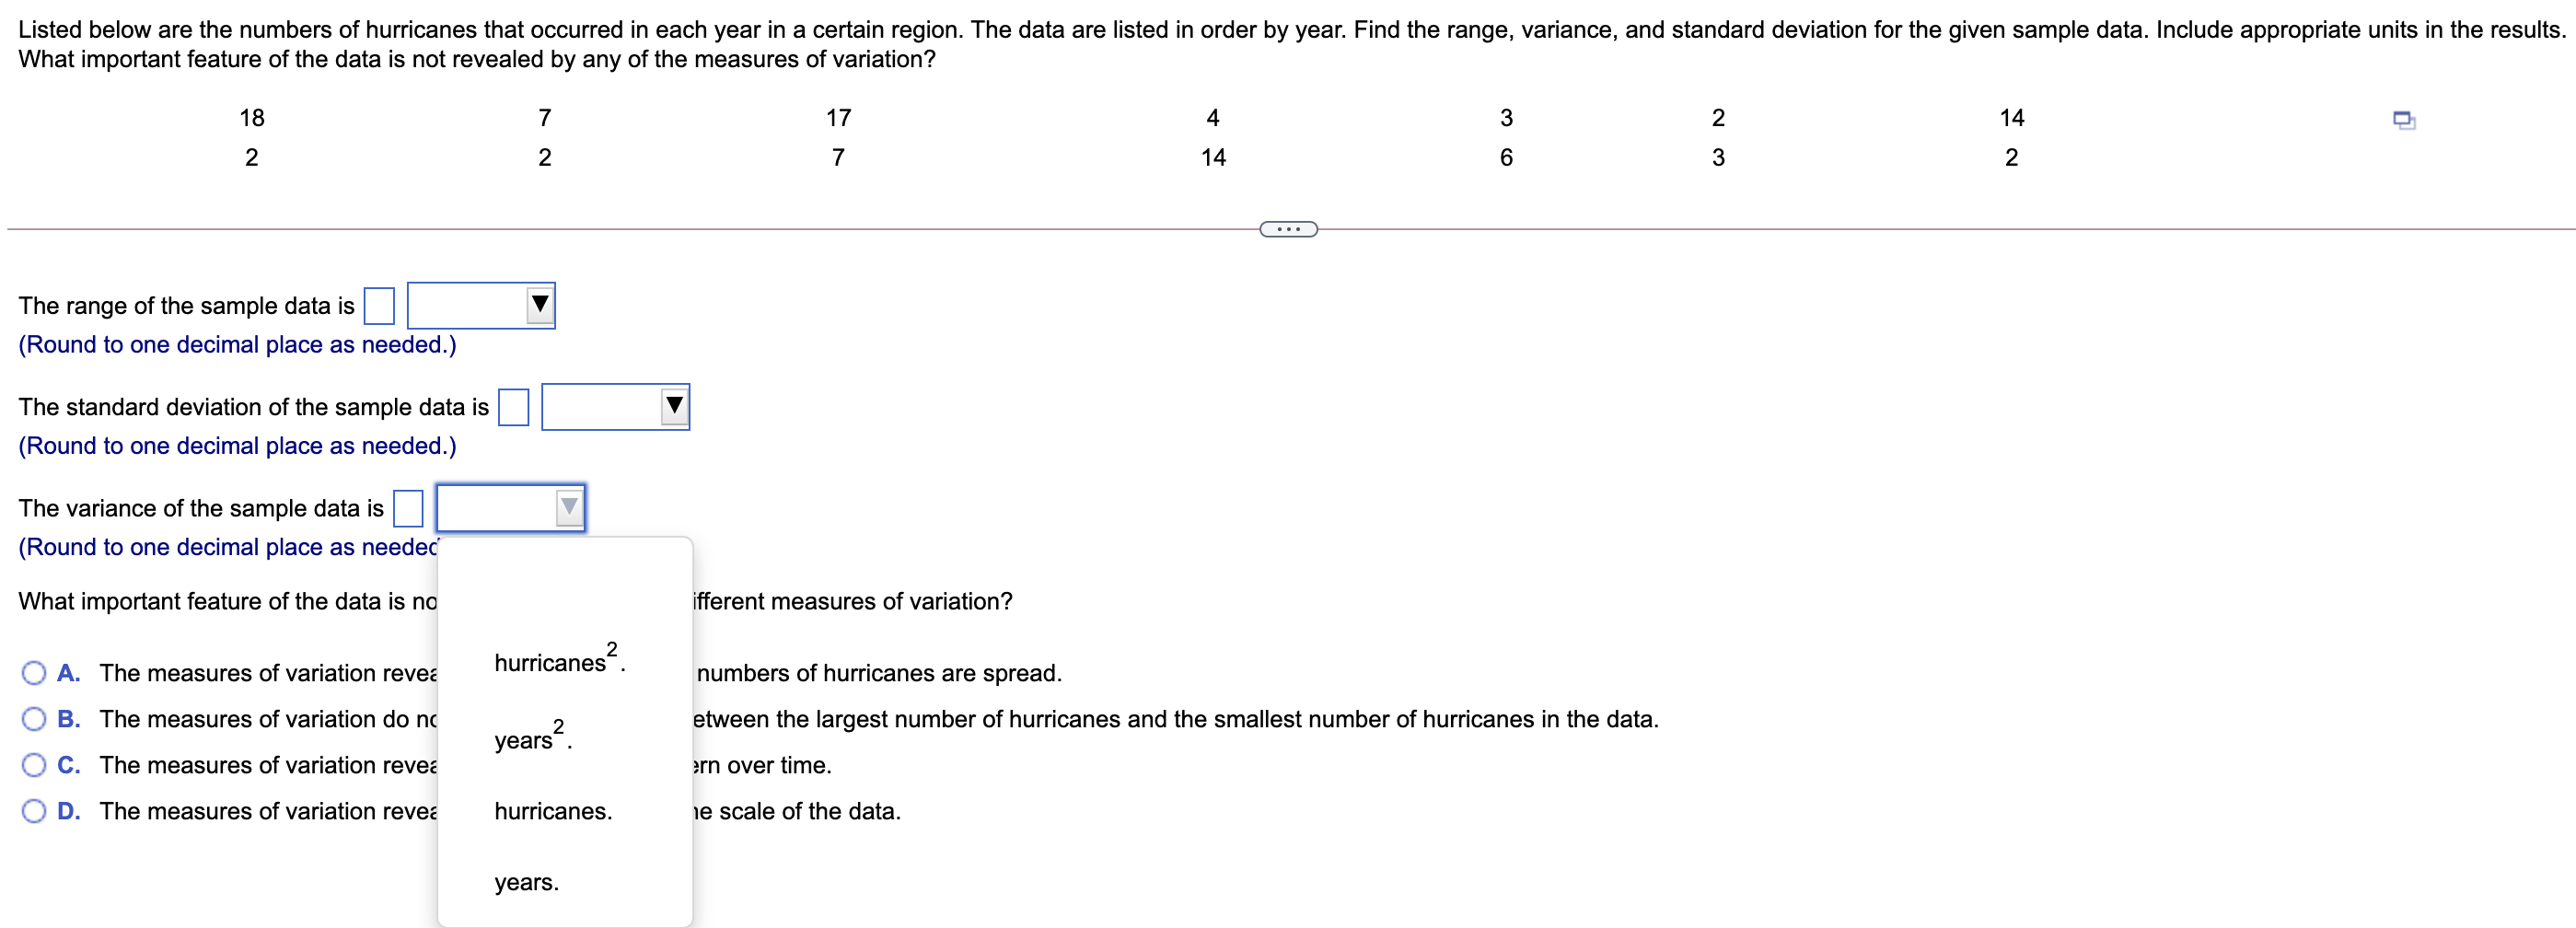
1. Listed below are the numbers of hurricanes that occurred in each year in a certain region. The data are listed in order by year.

image text in transcribedimage text in transcribedimage text in transcribedimage text in transcribedimage text in transcribedimage text in transcribedimage text in transcribed

1.

image text in transcribedimage text in transcribedimage text in transcribedimage text in transcribedimage text in transcribedimage text in transcribedimage text in transcribed
Listed below are the numbers of hurricanes that occurred in each year in a certain region. The data are listed in order by year. Find the range. variance, and standard deviation for the given sample data. Include appropriate units in the results. What important feature of the data is not revealed by any of the measures of variation? 18 7 17 4 3 2 14 Q: 2 2 7 14 6 3 2 The range of the sample data is E (Round to one decimal place as neet The standard deviation of the sample E (Round to one decimal place as nee( years. The variance of the sample data is I: 2 (Round to one decimal place as nee( years ' What important feature of the data is hurricanesz. a different measures of variation? 0 A. The measures of variation re' hurricanes. he numbers of hurricanes are spread. O B. The measures of variation do , _ _ ____ _,,_ ___,_. _...e between the largest number of hurricanes and the smallest number of hurricanes in the data. 0 C. The measures of variation reveal nothing about the pattern over time. O D. The measures of variation reveal no information about the scale of the data. Listed below are the numbers of hurricanes that occurred in each year in a certain region. The data are listed in order by year. Find the range, variance, and standard deviation for the given sample data. Include appropriate units in the results. What important feature of the data is not revealed by any of the measures of variation? 18 7 17 4 3 2 14 Q 2 2 7 14 6 3 2 The range of the sample data is 'V (Round to one decimal place as needed.) The standard deviation of the sample data is E (Round to one decimal place as needed.) The variance of the sample data is (Round to one decimal place as needed.) years. What important feature of the data is not revealed iasures of variation? hurricanes. O A. The measures of variation reveal nothing . 2 of hurricanes are spread. O B. The measures of variation do not reveal ti years ' s largest number of hurricanes and the smallest number of hurricanes in the data. 0 C. The measures of variation reveal nothing . . 2 he. hurricanes . O D. The measures of variation reveal no inforr lthe data. Listed below are the numbers of hurricanes that occurred in each year in a certain region. The data are listed in order by year. Find the range, variance, and standard deviation for the given sample data. Include appropriate units in the results. What important feature of the data is not revealed by any of the measures of variation? 18 7 17 4 3 2 14 Q 2 2 7 14 6 3 2 The range of the sample data is (Round to one decimal place as needed.) The standard deviation of the sample data is V (Round to one decimal place as needed.) The variance of the sample data is (Round to one decimal place as needec' What important feature of the data is no ifferent measures of variation? 0 A. The measures of variation revea hurricanesz. numbers of hurricanes are spread. O B. The measures of variation do n: 2 etween the largest number of hurricanes and the smallest number of hurricanes in the data. O c. The measures of variation revs: years I )m overtime. O D. The measures of variation revea hurricanes. re scale of the data. years. Find the (a) mean, (b) median, (0) mode, and (d) midrange for the given sample data. An experiment was conducted to determine whether a deciency of carbon dioxide in the soil affects the phenotype of peas. Listed below are the phenotype codes where 1 = smooth-yellow, 2 = smooth-green, 3 = wrinkled-yellow, and 4 = wrinkled-green. Do the results make sense? 4 4 2 4 2 1 1 2 4 2 1 2 2 3 Q} (a) The mean phenotype code is . (Round to the nearest tenth as needed.) (b) The median phenotype code is (Type an integer or a decimal.) (c) Select the correct choice below and ll in any answer boxes within your choice. O A- The mode phenotype code is . (Use a comma to separate answers as needed.) O B. There is no mode. (d) The midrange of the phenotype codes is (Type an integer or a decimal.) Do the measures of center make sense? 0 A. Only the mean, median, and mode make sense since the data is numerical. O B. Only the mode makes sense since the data is nominal. O C. All the measures of center make sense since the data is numerical. O D. Only the mean, median, and midrange make sense since the data is nominal. Use the magnitudes (Richter scale) of the earthquakes listed in the data set below, Find the mean and median of this data set. Is the magnitude of an earthquake measuring 7.0 on the Richter scale an outlier (data value that is very far away from the others) when considered in the context of the sample data given in this data set? Explain. a Click the icon to view the earthquake Richter scale data. Find the mean and median of the data set using a calculator or similar data analysis technology. The mean of the data set is , More info (Round to three decimal places as needed.) The median of the data set is . (Round to three decimal places as needed) Is the magnitude of an earthquake measuring 7.0 on the Richter scale an outlier when considered in the context of the sample data given? 0 A. Yes. because this value is very far away from all of the other data values O B. Yes, because this value is the maximum data value. O C. No, because this value is not very far away from all ofthe other data values 0 D. No, because this value is not the maximum data value. Use 2 scores to compare the given values. In a recent awards ceremony, the age of the winner for best actor was 31 and the age of the winner for best actress was 44, For all best actors, the mean age is 42.7 years and the standard deviation is 6.4 years. For all best actresses, the mean age is 32.6 years and the standard deviation is 10.2 years. (All ages are determined at the time of the awards ceremony.) Relative to their genders, who had the more extreme age when winning the award, the actor or the actress? Explain. Since the z score for the actor is z = and the z score for the actress is z = , the E had the more extreme age. (Round to two decimal places.) actress The blood platelet counts of a group of women have a bell-shaped distribution with a mean of 254.3 and a standard deviation of 67.2. (All units are 1000 cells/pL.) Using the empirical rule, nd each approximate percentage below. a. What is the approximate percentage of women with platelet counts within 3 standard deviations of the mean, or between 52.7 and 455.97 b. What is the approximate percentage of women with platelet counts between 187.1 and 321.5? a. Approximately D% of women in this group have platelet counts within 3 standard deviations of the mean, or between 52.7 and 455.9. (Type an integer or a decimal. Do not round.) b. Approximately % of women in this group have platelet counts between 187.1 and 321.5. (Type an integer or a decimal. Do not round.)

Step by Step Solution

There are 3 Steps involved in it

Step: 1

blur-text-image

Get Instant Access to Expert-Tailored Solutions

See step-by-step solutions with expert insights and AI powered tools for academic success

Step: 2

blur-text-image

Step: 3

blur-text-image

Ace Your Homework with AI

Get the answers you need in no time with our AI-driven, step-by-step assistance

Get Started

Recommended Textbook for

Contemporary Mathematics

Authors: OpenStax

1st Edition

1711470554, 978-1711470559

Students also viewed these Mathematics questions