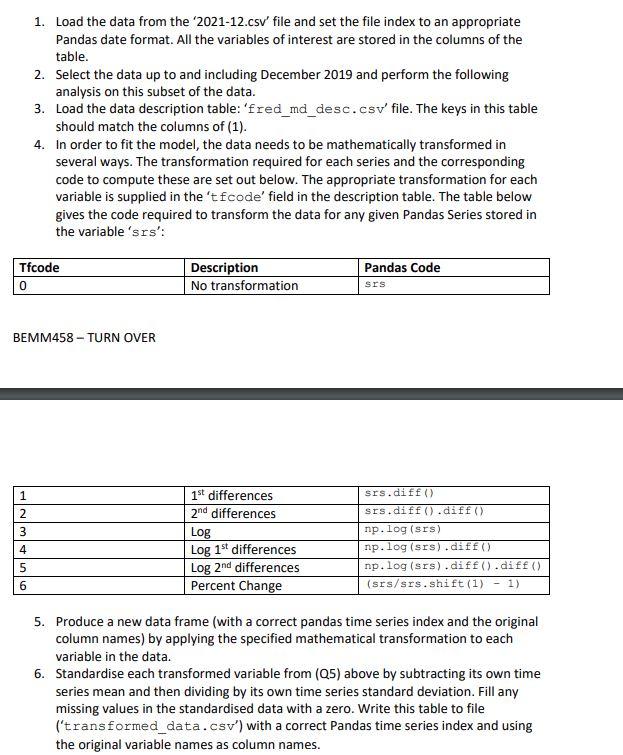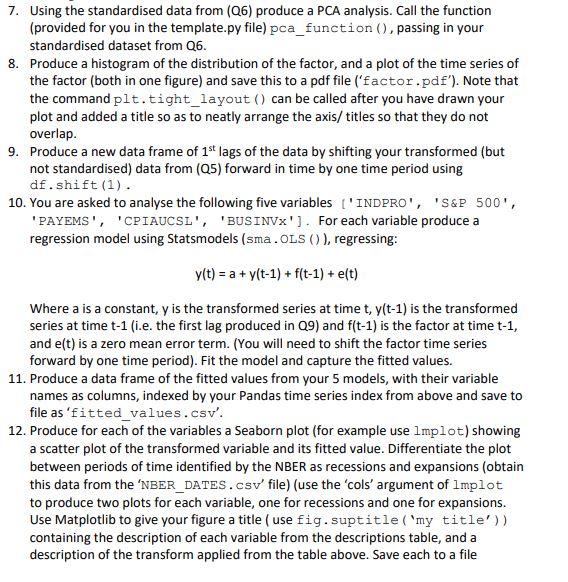


1. Load the data from the '2021-12.csv' file and set the file index to an appropriate Pandas date format. All the variables of interest are stored in the columns of the table. 2. Select the data up to and including December 2019 and perform the following analysis on this subset of the data. 3. Load the data description table: 'fred_md_desc. csv' file. The keys in this table should match the columns of (1). 4. In order to fit the model, the data needs to be mathematically transformed in several ways. The transformation required for each series and the corresponding code to compute these are set out below. The appropriate transformation for each variable is supplied in the ' t fcode' field in the description table. The table below gives the code required to transform the data for any given Pandas Series stored in the variable'srs': 5. Produce a new data frame (with a correct pandas time series index and the original column names) by applying the specified mathematical transformation to each variable in the data. 6. Standardise each transformed variable from (Q5) above by subtracting its own time series mean and then dividing by its own time series standard deviation. Fill any missing values in the standardised data with a zero. Write this table to file ('transformed_data.csv') with a correct Pandas time series index and using the original variable names as column names. 7. Using the standardised data from (Q6) produce a PCA analysis. Call the function (provided for you in the template.py file) pca_function (), passing in your standardised dataset from Q6. 8. Produce a histogram of the distribution of the factor, and a plot of the time series of the factor (both in one figure) and save this to a pdf file ('factor.pdf'). Note that the command plt.tight_layout () can be called after you have drawn your plot and added a title so as to neatly arrange the axis/ titles so that they do not overlap. 9. Produce a new data frame of 1st lags of the data by shifting your transformed (but not standardised) data from (Q5) forward in time by one time period using df.shift(1). 10. You are asked to analyse the following five variables ['INDRRO', 'S\&P 500, 'PAYEMS', 'CPIAUCSL', 'BUSINVX']. For each variable produce a regression model using Statsmodels (sma. OLS ()), regressing: y(t)=a+y(t1)+f(t1)+e(t) Where a is a constant, y is the transformed series at time t,y(t1) is the transformed series at time t1 (i.e. the first lag produced in Q9 ) and f(t1) is the factor at time t1, and e(t) is a zero mean error term. (You will need to shift the factor time series forward by one time period). Fit the model and capture the fitted values. 11. Produce a data frame of the fitted values from your 5 models, with their variable names as columns, indexed by your Pandas time series index from above and save to file as 'fitted_values.csv'. 12. Produce for each of the variables a Seaborn plot (for example use 1mpl lot) showing a scatter plot of the transformed variable and its fitted value. Differentiate the plot between periods of time identified by the NBER as recessions and expansions (obtain this data from the 'NBER_DATES. CSV' file) (use the 'cols' argument of lmplot to produce two plots for each variable, one for recessions and one for expansions. Use Matplotlib to give your figure a title (use fig. suptitle ('my title')) containing the description of each variable from the descriptions table, and a description of the transform applied from the table above. Save each to a file 'srs.pdf' where srs is the key for each series. (Note that if plot = sns. Implot (...) then plot. figure returns a Matplotlib figure.)


