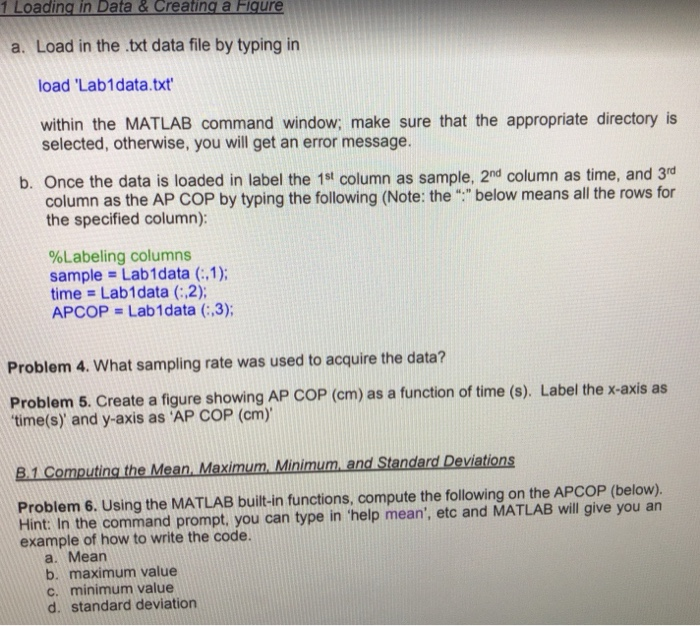
1 Loading in Data &Creating a Fiqure a. Load in the.txt data file by typing in load 'Lab1data.txt within the MATLAB command window; make sure that the appropriate directory is selected, otherwise, you will get an error message. b. Once the data is loaded in label the 1st column as sample, 2nd column as time, and 3rd column as the AP COP by typing the following (Note: the "below means all the rows for the specified column): %Labeling columns sample = Lab!data (:1); time = Labi data (: ,2); APCOP Lab1data (:,3); Problem 4. What sampling rate was used to acquire the data? Problem 5. Create a figure showing AP COP (cm) as a function of time (s). Label the x-axis as time(s), and y-axis as 'AP COP (cm). B.1 Computing the Mean Maximum Minimum, and Standard Deviations Problem 6. Using the MATLAB built-in functions, compute the following on the APCOP (below). Hint: In the command prompt, you can type in 'help mean', etc and MATLAB will give you an example of how to write the code. a. Mearn b. maximum value c. minimum value d. standard deviation 1 Loading in Data &Creating a Fiqure a. Load in the.txt data file by typing in load 'Lab1data.txt within the MATLAB command window; make sure that the appropriate directory is selected, otherwise, you will get an error message. b. Once the data is loaded in label the 1st column as sample, 2nd column as time, and 3rd column as the AP COP by typing the following (Note: the "below means all the rows for the specified column): %Labeling columns sample = Lab!data (:1); time = Labi data (: ,2); APCOP Lab1data (:,3); Problem 4. What sampling rate was used to acquire the data? Problem 5. Create a figure showing AP COP (cm) as a function of time (s). Label the x-axis as time(s), and y-axis as 'AP COP (cm). B.1 Computing the Mean Maximum Minimum, and Standard Deviations Problem 6. Using the MATLAB built-in functions, compute the following on the APCOP (below). Hint: In the command prompt, you can type in 'help mean', etc and MATLAB will give you an example of how to write the code. a. Mearn b. maximum value c. minimum value d. standard deviation


