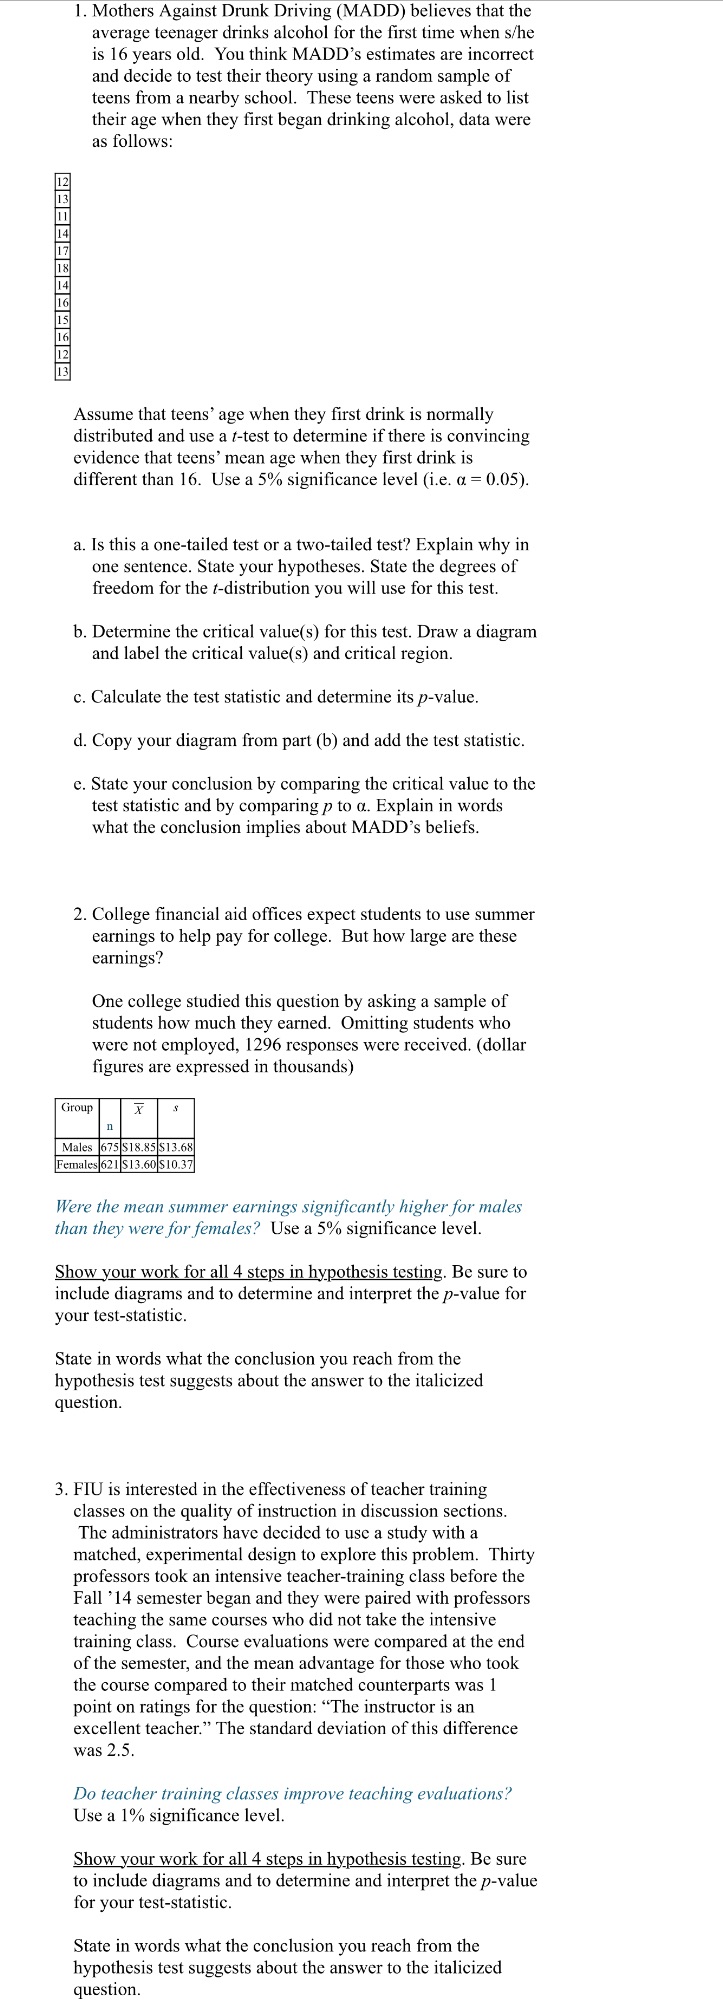
1. Mothers Against Drunk Driving (MADD) believes that the average teenager drinks alcohol for the first ime when sthe is 16 years old. You think MADD's estimates are incorrect and decide to test their theory using a random sample of teens from a nearby school. These teens were asked to list their age when they first began drinking alcohol, data were as follows: Assume that teens' age when they first drink is normally distributed and use a t-test to determine if there is convincing evidence that teens' mean age when they first drink is different than 16. Use a 5% significance level (i.e. a=0.05). a. Is this a one-tailed test or a two-tailed test? Explain why in one sentence. Stale your hypotheses. State the degrees of freedom for the -distribution you will use for this test. b. Determine the critical value(s) for this test. Draw a diagram and label the critical value(s) and critical region. c. Calculate the test statistic and determine its p-value. d. Copy your diagram [rom part (b) and add the test statistic. . Statc your conclusion by comparing the critical value to the test statistic and by comparing p to a. Explain in words what the conclusion implies about MADD's beliefs. 2. College financial aid offices expect students to use summer earnings to help pay for college. But how large are these camings? One college studied this question by asking a sample of students how much they earned. Omitting students who were not employed, 1296 responses were received. (dollar figures are expressed in thousands) Group T | n Males J675] Femulesf62 1 S18.85[513.68 S13.60[510.37] Were the mean summer earnings significantly higher for males than they were for females? Use a 5% significance level. Show your work for all 4 steps in hypothesis testing. Be sure to include diagrams and to determine and interpret the p-value for your test-statistic. State in words what the conclusion you reach from the hypothesis test suggests about the answer to the italicized question. 3. FIU is interested in the effectiveness of teacher training classes on the quality of instruction in discussion sections. The administrators have decided to usc a study with a matched, experimental design to explore this problem. Thirty professors took an intensive teacher-training class before the Fall "14 semester began and they were paired with professors teaching the same courses who did not take the intensive training class. Course evaluations were compared at the end of the semester, and the mean advantage for those who took the course compared to their matched counterparts was 1 point on ratings for the question: \"The instructor is an excellent teacher.\" The standard deviation of this difference was 2.5. Do teacher training classes improve teaching evaluations? Use a 1% significance level. Show your work for all 4 steps in hypothesis testing. Be sure to include diagrams and to determine and interpret the p-value for your test-statistic. State in words what the conclusion you reach from the hypothesis test suggests about the answer to the italicized


