

Question: 1. Observe the three different videos in this lab interactive. What do you notice happening in the video? Describe and Identify at least 3 unique
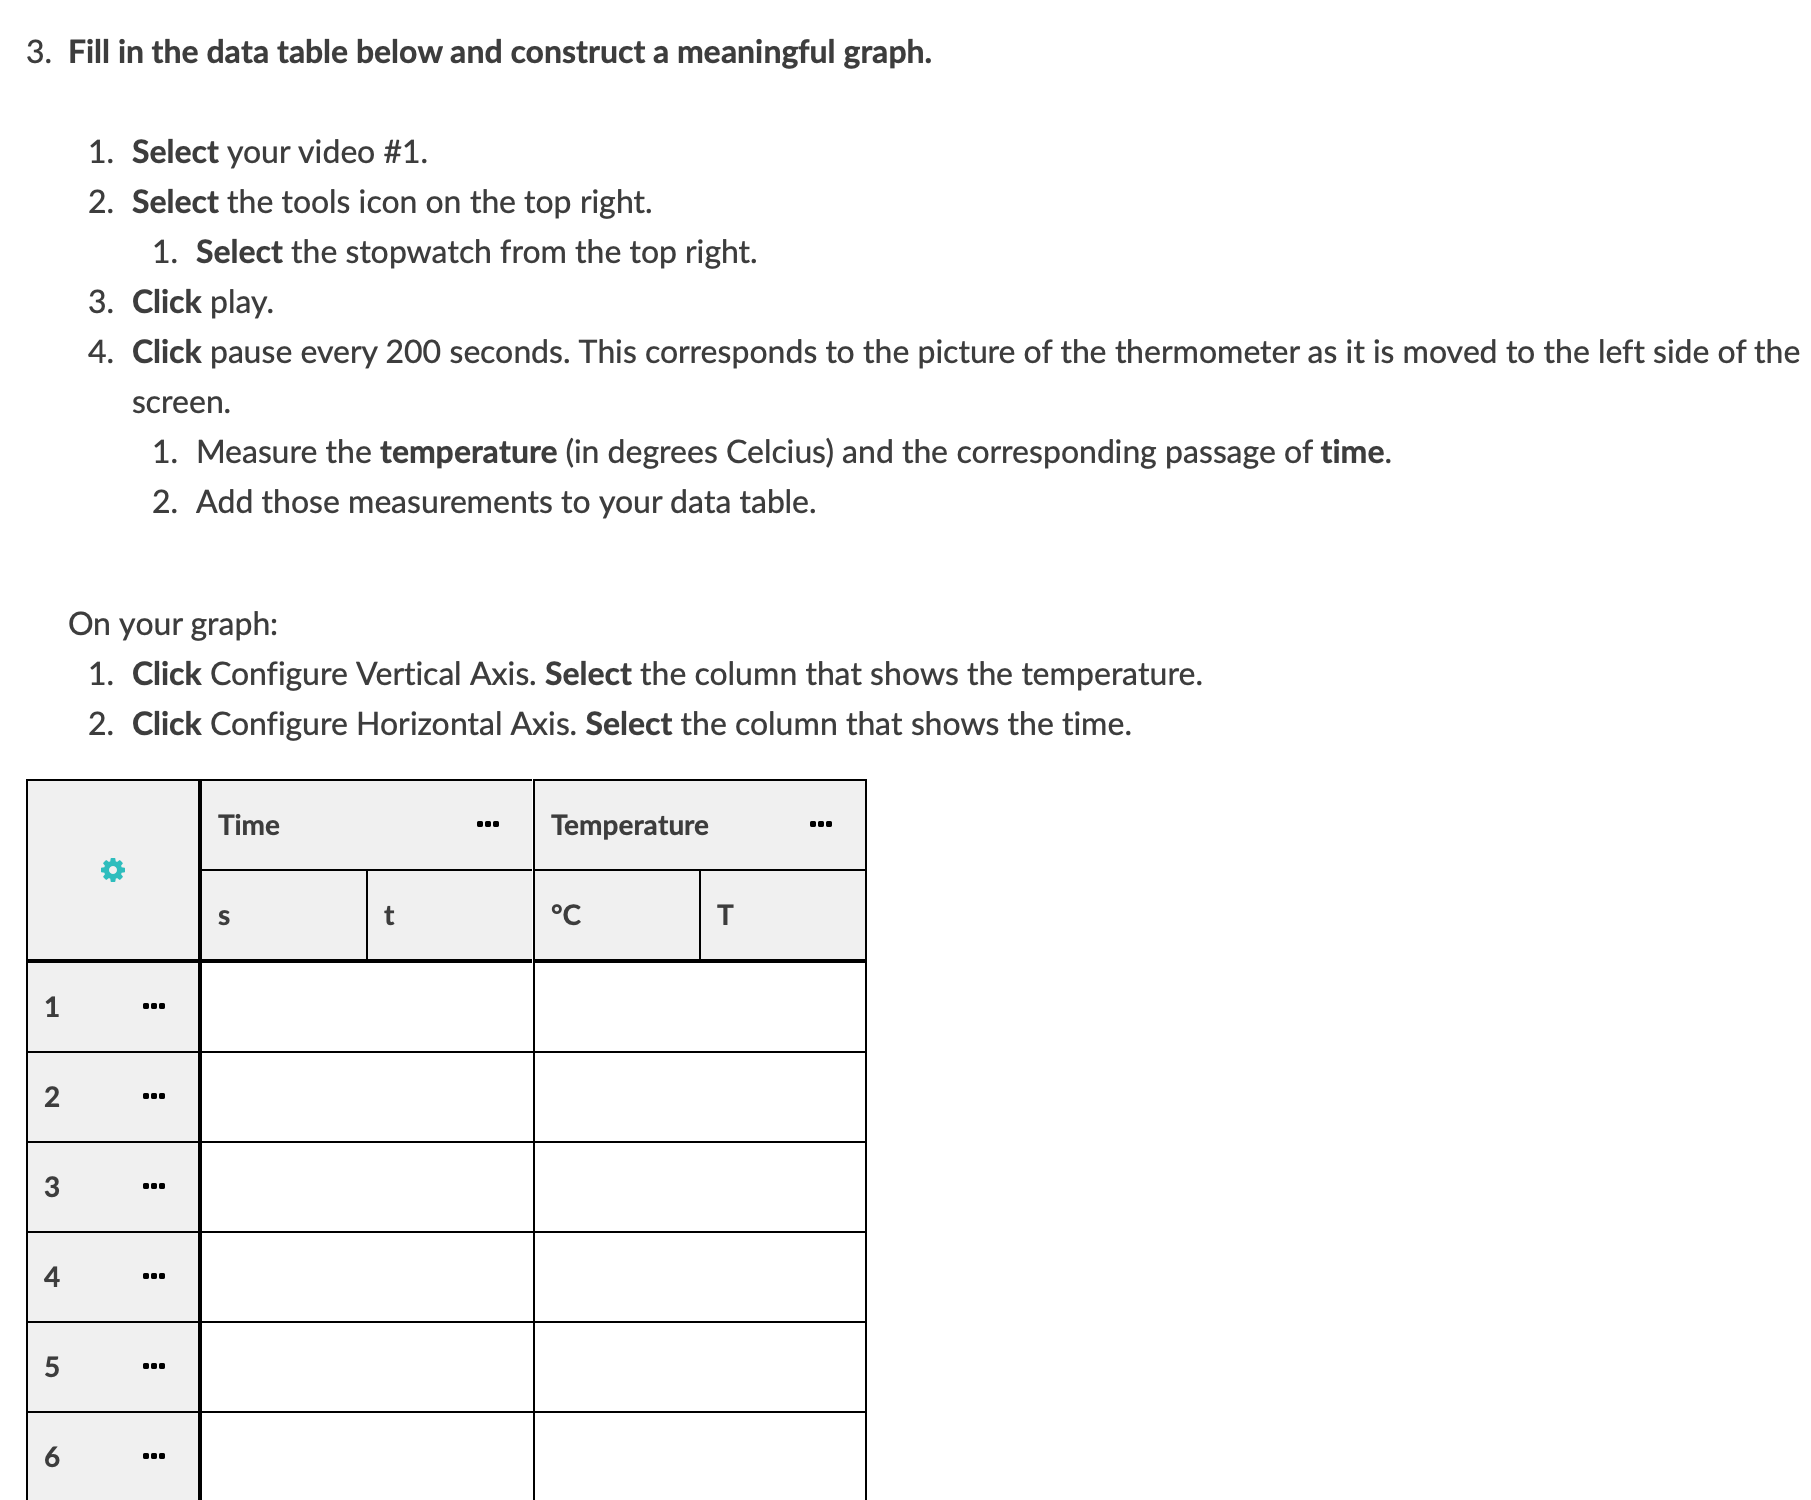
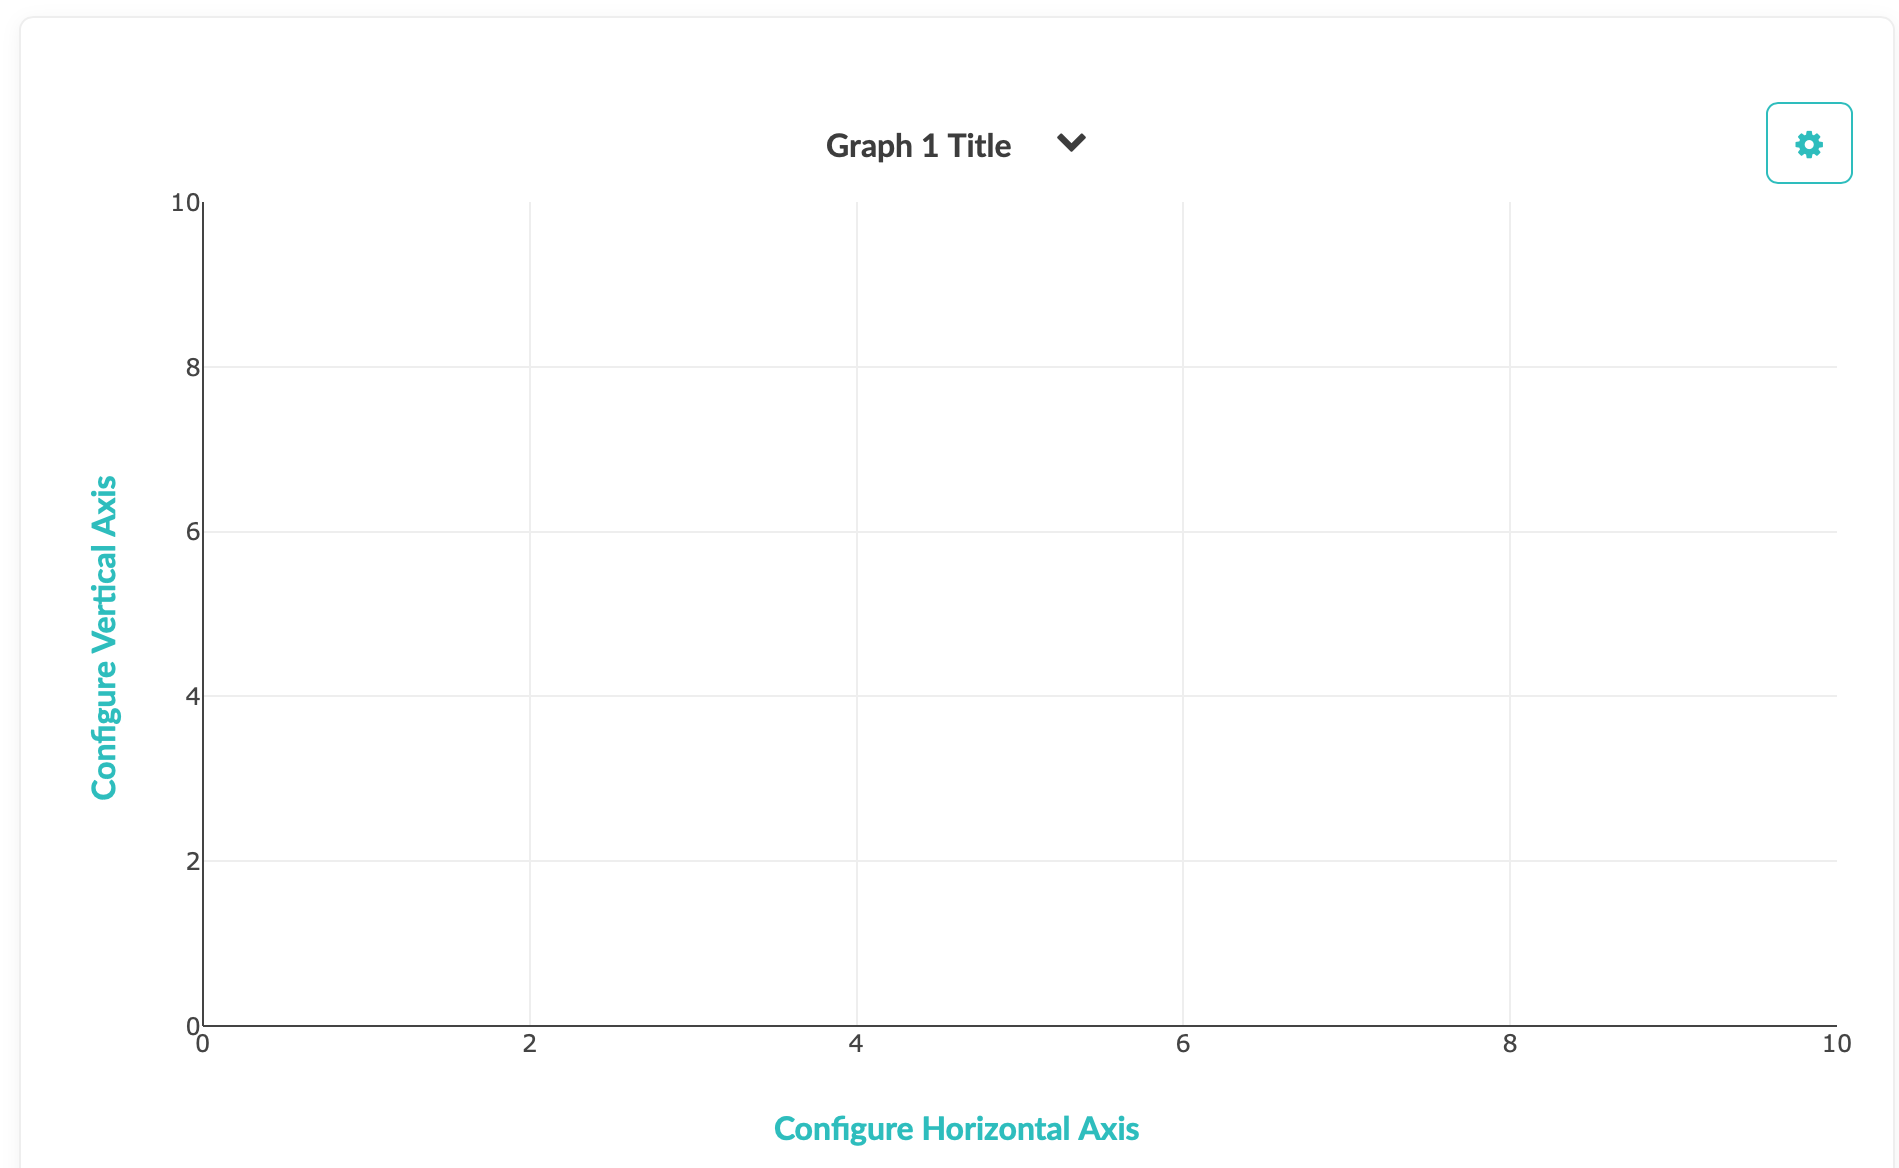
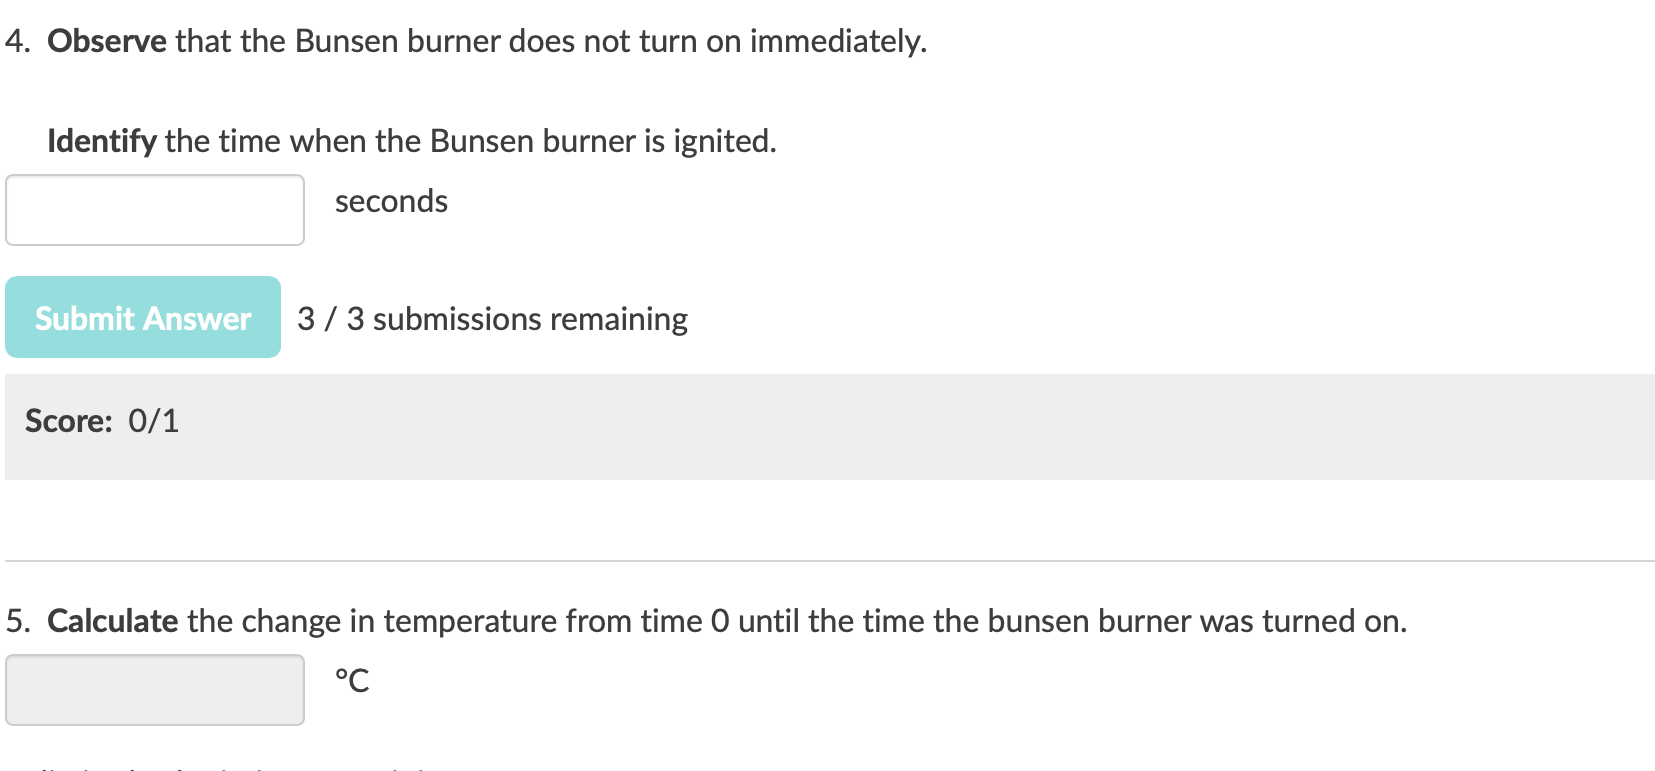
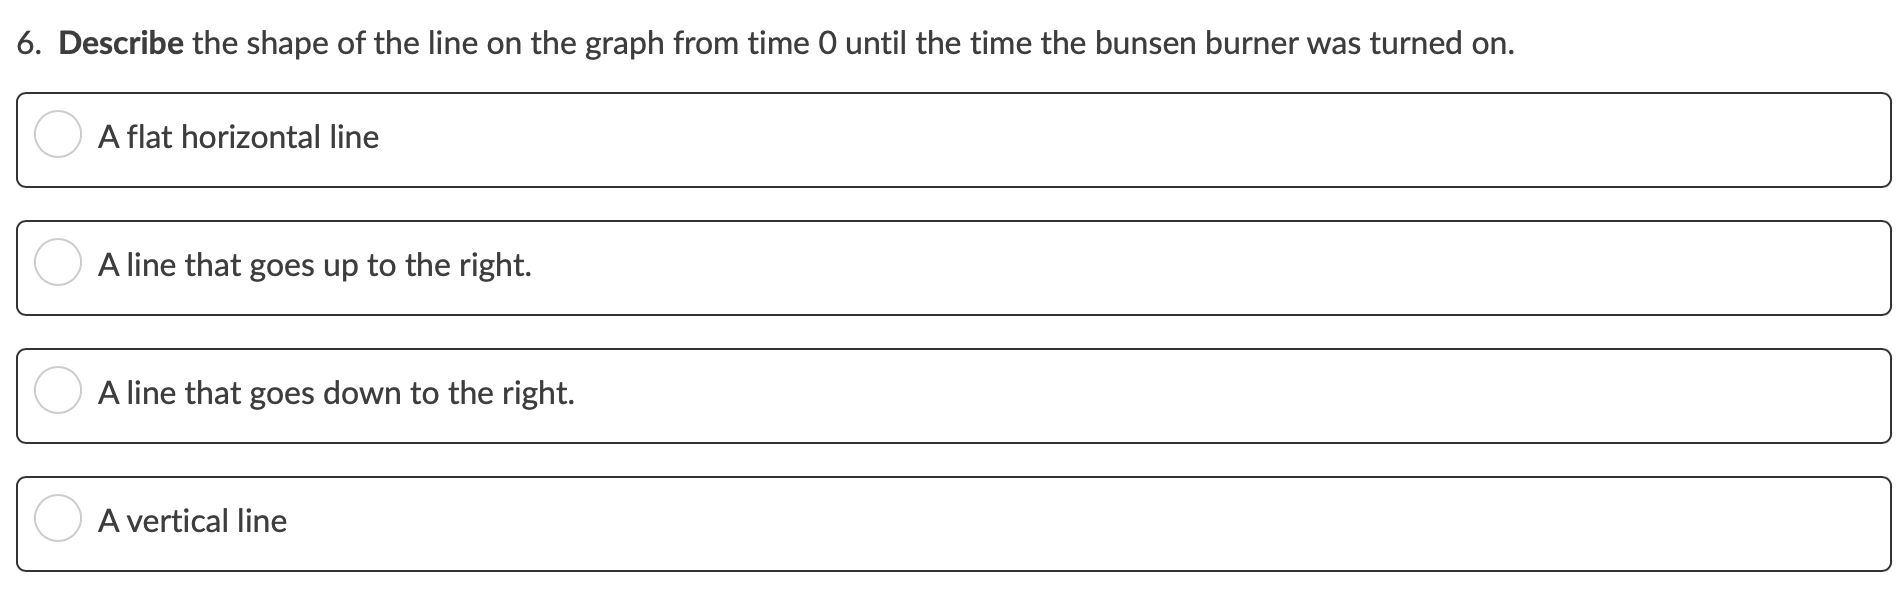
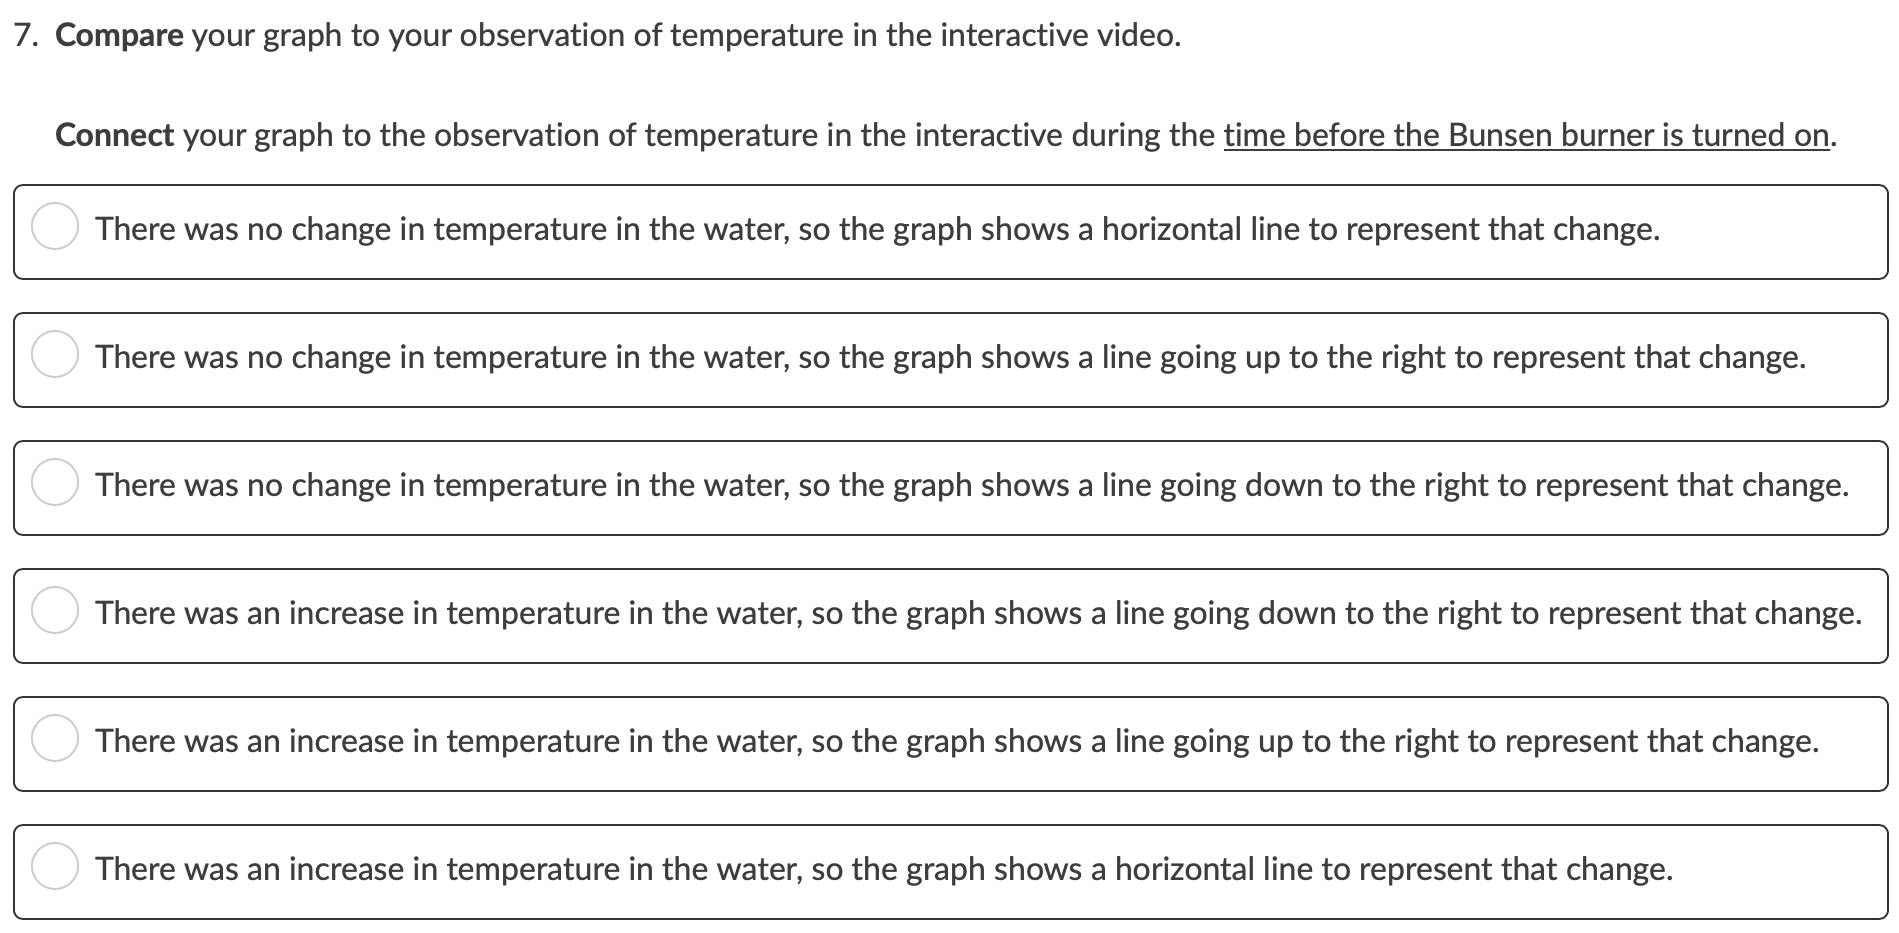
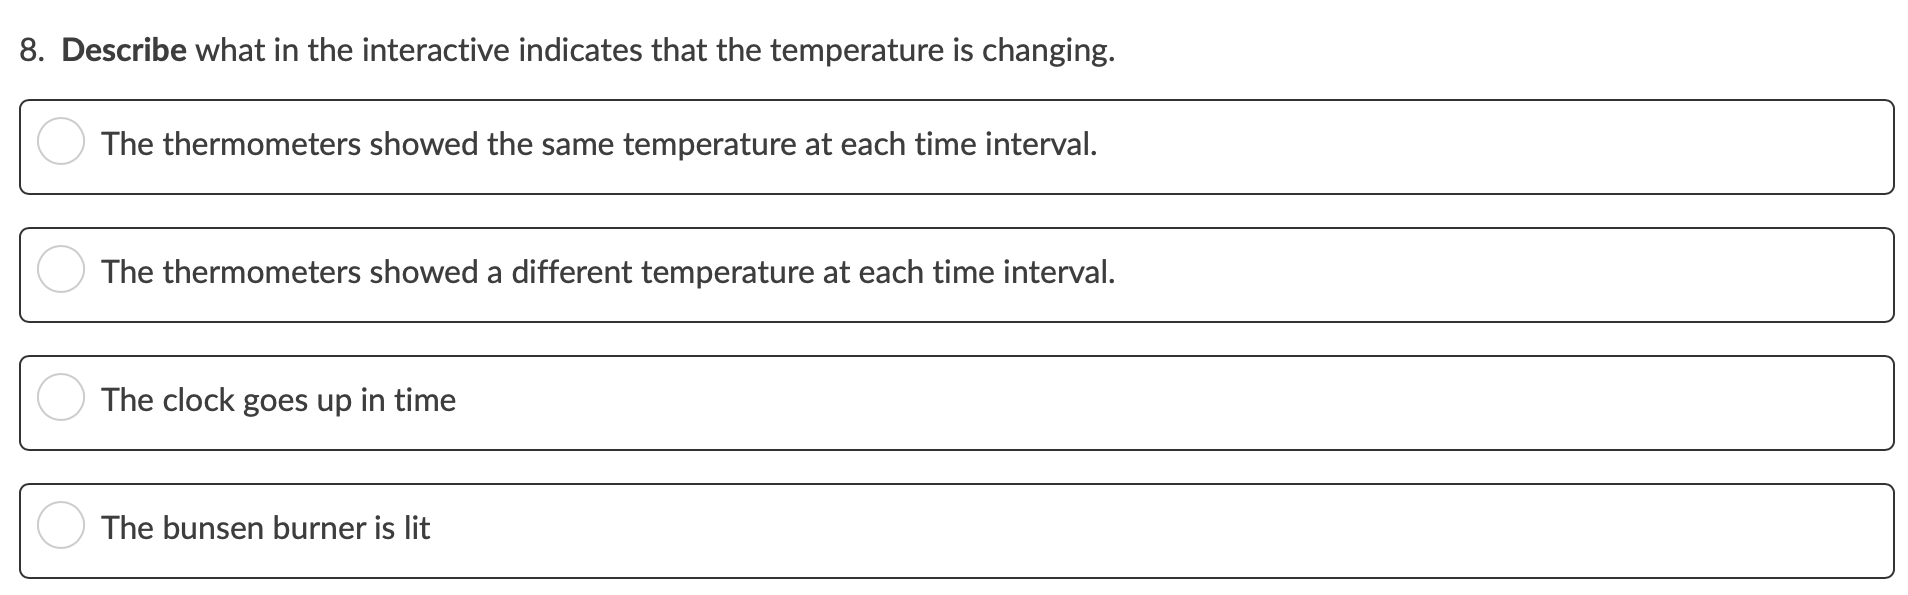
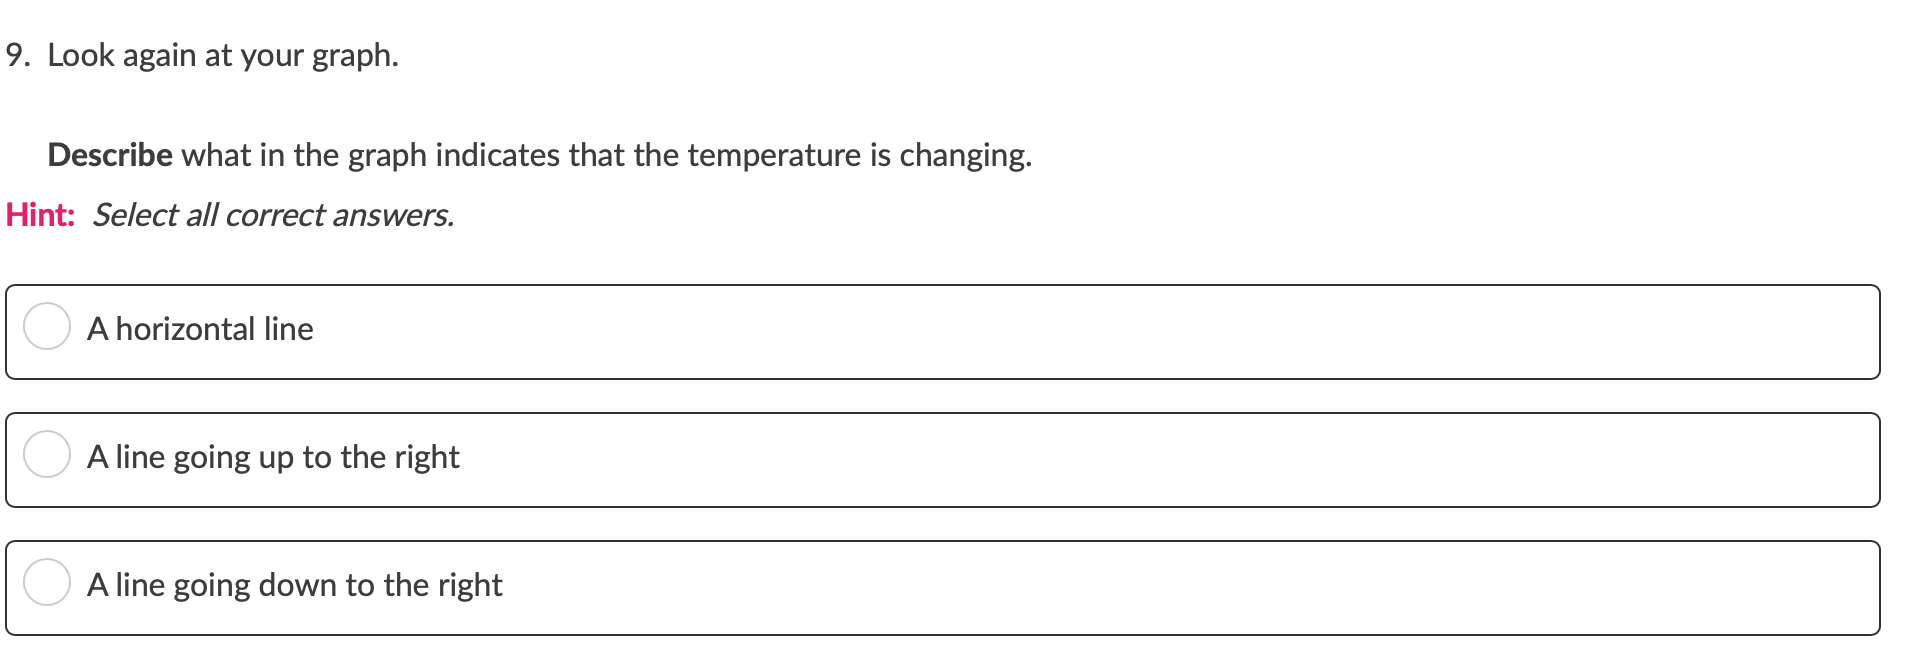
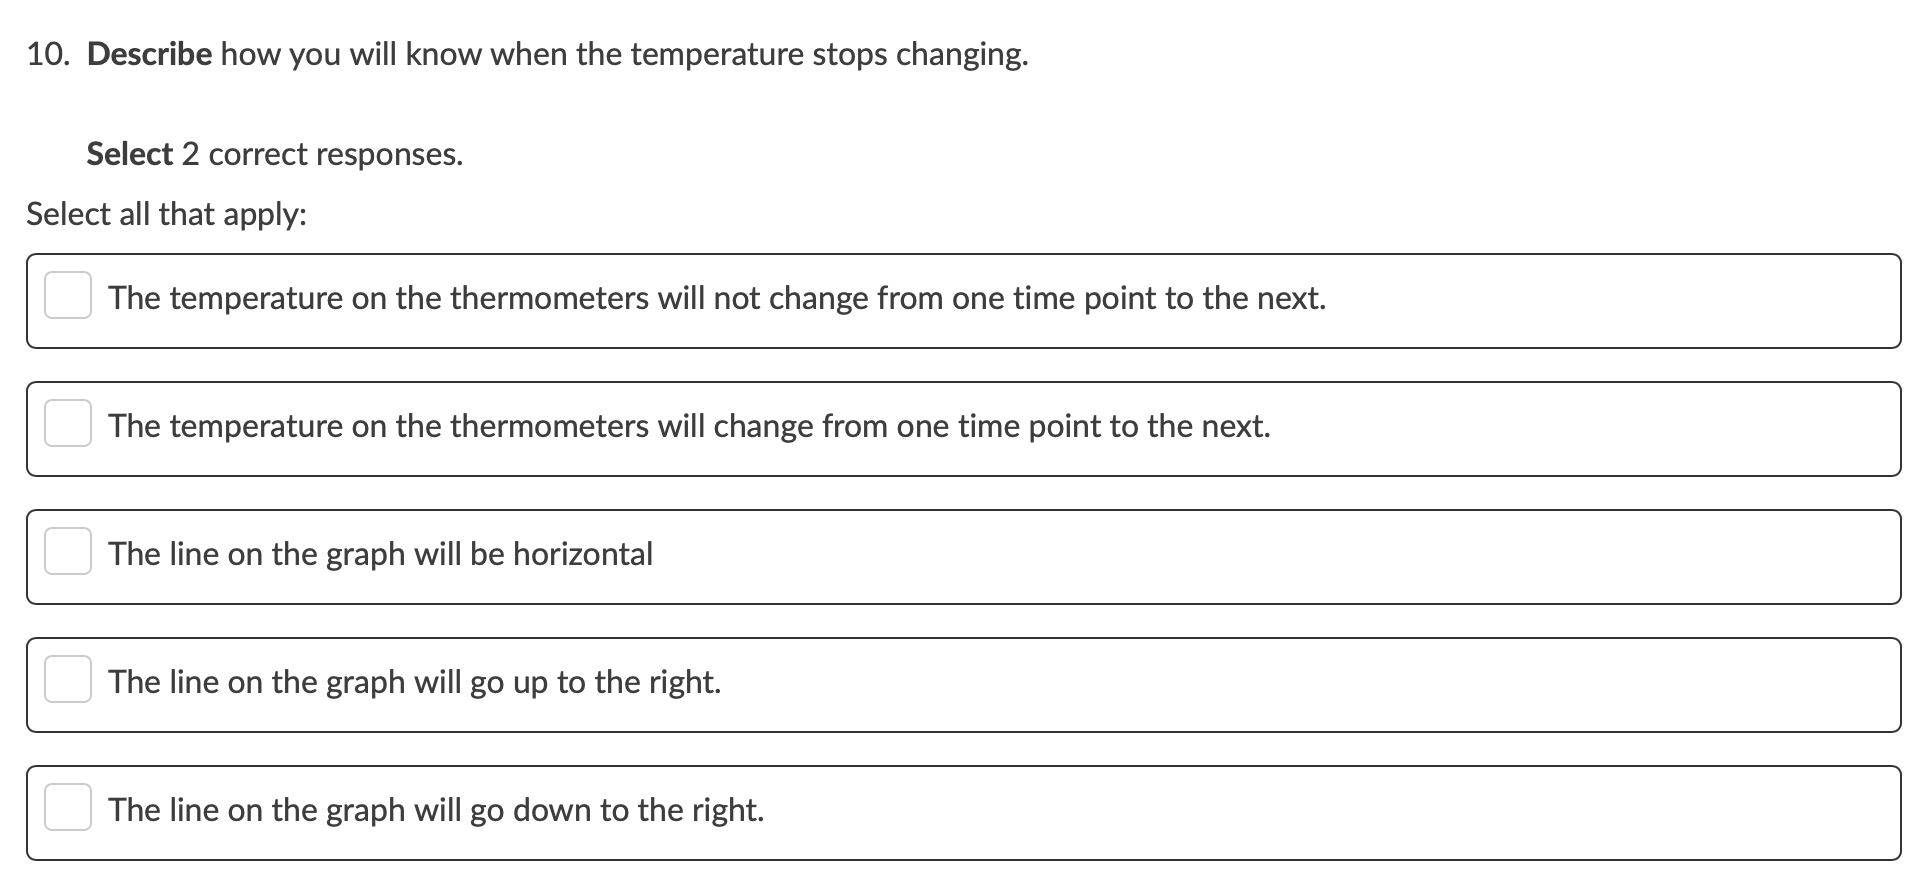
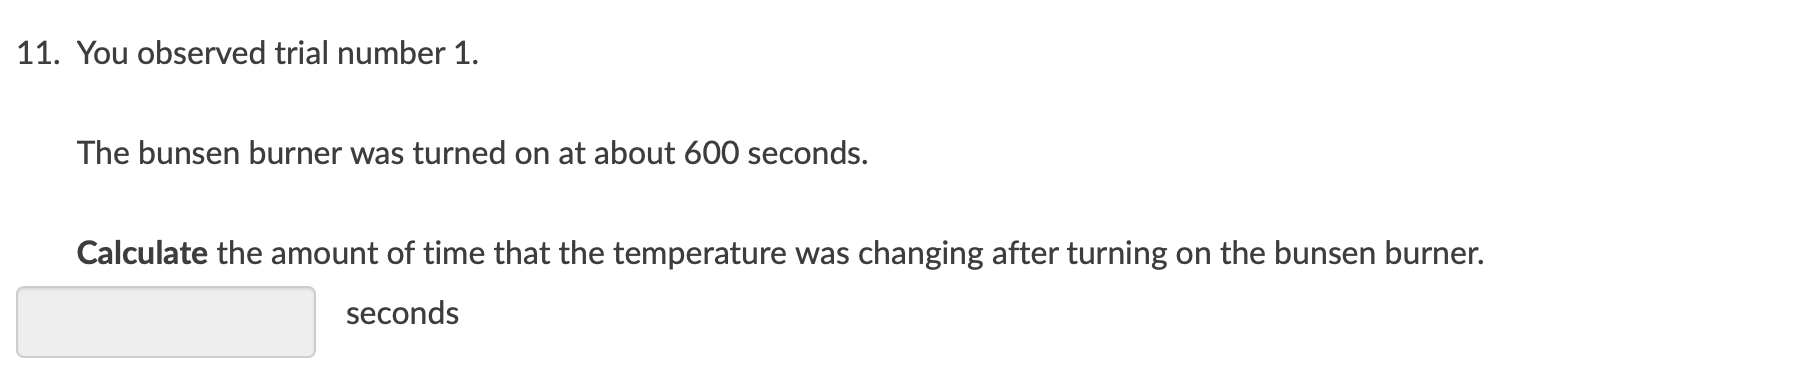
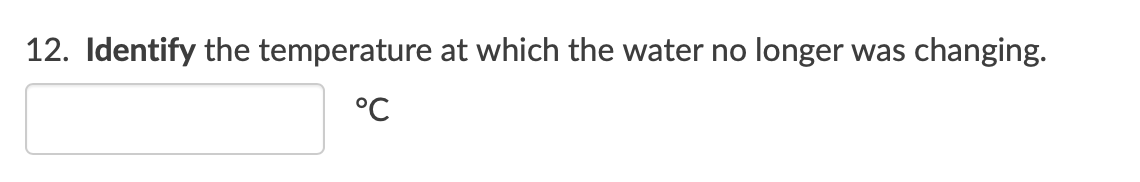
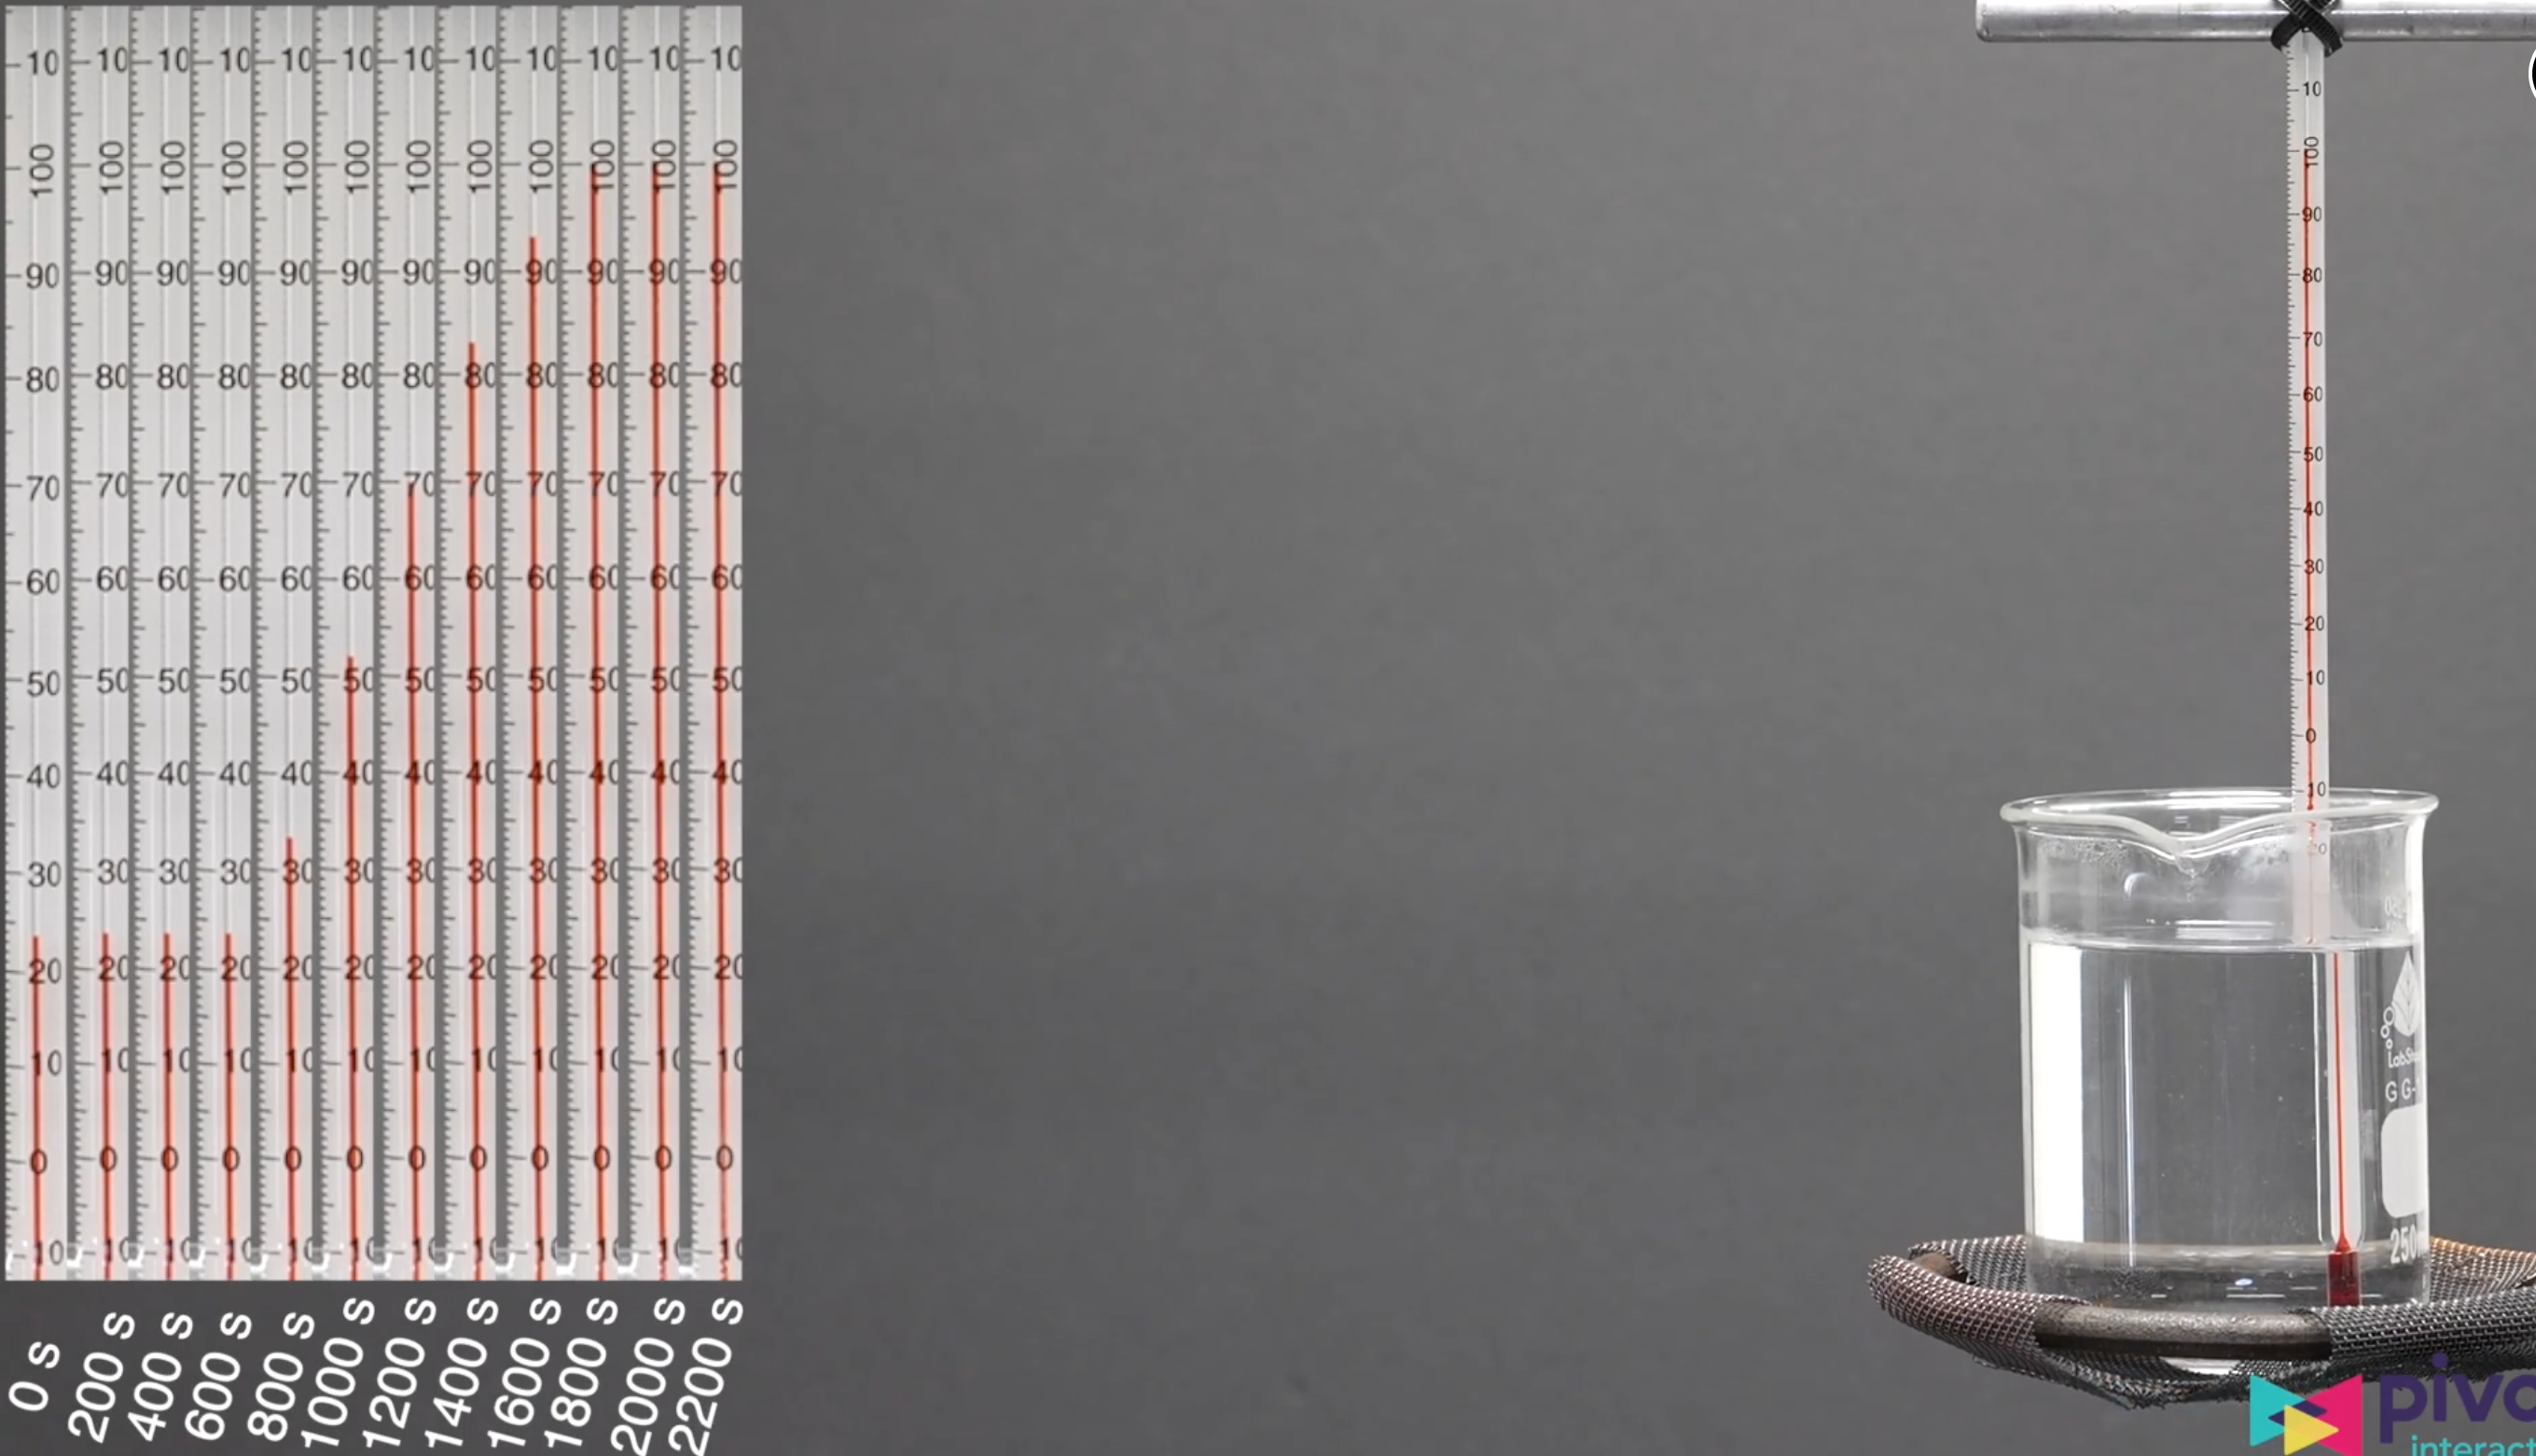
1. Observe the three different videos in this lab interactive. What do you notice happening in the video? Describe and Identify at least 3 unique observations. BI U Score: 0/1 2. You are assigned trial #1 for this part of the activity. Enter this trial # into the field below. trial #3. Fill in the data table below and construct a meaningful graph. 1. Select your video #1. 2. Select the tools icon on the top right. 1. Select the stopwatch from the top right. 3. Click play. 4. Click pause every 200 seconds. This corresponds to the picture of the thermometer as it is moved to the left side of the screen. 1. Measure the temperature (in degrees Celcius) and the corresponding passage of time. 2. Add those measurements to your data table. On your graph: 1. Click Configure Vertical Axis. Select the column that shows the temperature. 2. Click Configure Horizontal Axis. Select the column that shows the time. Time Temperature \f4. Observe that the Bunsen burner does not turn on immediately. Identify the time when the Bunsen burner is ignited. seconds 3 / 3 submissions remaining Score: 0/1 5. Calculate the change in temperature from time 0 until the time the bunsen burner was turned on. C 6. Describe the shape of the line on the graph from time O until the time the bunsen burner was turned on. O A flat horizontal line A line that goes up to the right. O A line that goes down to the right. O A vertical line7. Compare your graph to your observation of temperature in the interactive video. Connect your graph to the observation of temperature in the interactive during the time before the Bunsen burner is turned on. There was no change in temperature in the water, so the graph shows a horizontal line to represent that change. There was no change in temperature in the water, so the graph shows a line going up to the right to represent that change. There was no change in temperature in the water, so the graph shows a line going down to the right to represent that change. There was an increase in temperature in the water, so the graph shows a line going down to the right to represent that change. There was an increase in temperature in the water, so the graph shows a line going up to the right to represent that change. There was an increase in temperature in the water, so the graph shows a horizontal line to represent that change. 8. Describe what in the interactive indicates that the temperature is changing. The thermometers showed the same temperature at each time interval. The thermometers showed a different temperature at each time interval. The clock goes up in time The bunsen burner is lit ] 9. Look again at your graph. Describe what in the graph indicates that the temperature is changing. Hint: Select all correct answers. A horizontal line A line going up to the right ' A line going down to the right I 10. Describe how you will know when the temperature stops changing. Select 2 correct responses. Select all that apply: The temperature on the thermometers will not change from one time point to the next. The temperature on the thermometers will change from one time point to the next. The line on the graph will be horizontal The line on the graph will go up to the right. The line on the graph will go down to the right. 11. You observed trial number 1. The bunsen burner was turned on at about 600 seconds. Calculate the amount of time that the temperature was changing after turning on the bunsen burner. seconds 12. Identify the temperature at which the water no longer was changing. C \f
Step by Step Solution
There are 3 Steps involved in it
Based on the images provided here is a corrected and detailed response Observations from the Videos ... View full answer

Get step-by-step solutions from verified subject matter experts