Answered step by step
Verified Expert Solution
Question
1 Approved Answer
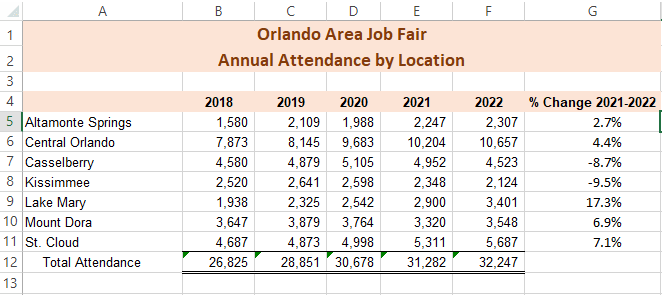
1. On the Attendance Data worksheet, select the ranges A4:A11 and F4:G11 and use the Insert tab to create a Clustered Column Combo chart with

1. On the Attendance Data worksheet, select the ranges A4:A11 and F4:G11 and use the Insert tab to create a Clustered Column Combo chart with a Line on the Secondary Axis.
2. Move the chart to a sheet named 2022 Combo Chart
3. Insert Column Sparklines in the range G5:G11 using B5:F11 as the data source.
4. Show the Low Points on the sparklines.
5. Simultaneously apply Red, Sparkline Style Dark #3 to the sparklines in G5:G11.
6. Use the same axis for all sparklines in the Vertical Axis Minimum Value and the Vertical Axis Maximum Value.
Step by Step Solution
There are 3 Steps involved in it
Step: 1

Get Instant Access to Expert-Tailored Solutions
See step-by-step solutions with expert insights and AI powered tools for academic success
Step: 2

Step: 3

Ace Your Homework with AI
Get the answers you need in no time with our AI-driven, step-by-step assistance
Get Started


