Answered step by step
Verified Expert Solution
Link Copied!

Question

1 Approved Answer

1. On the graph shown to the right: a. Indicate the abscissa. b. Indicate the ordinate. c. Identify the independent variable. d. Circle the origin.
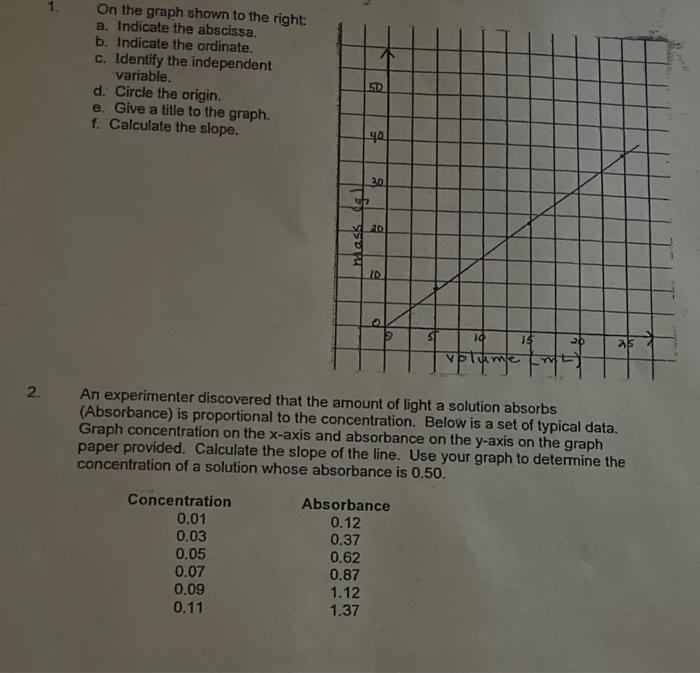
image text in transcribed
1. On the graph shown to the right: a. Indicate the abscissa. b. Indicate the ordinate. c. Identify the independent variable. d. Circle the origin. e. Give a title to the graph. f. Calculate the slope. An experimenter discovered that the amount of light a solution absorbs (Absorbance) is proportional to the concentration. Below is a set of typical data. Graph concentration on the x-axis and absorbance on the y-axis on the graph paper provided. Calculate the slope of the line. Use your graph to determine the concentration of a solution whose absorbance is 0.50

Step by Step Solution

There are 3 Steps involved in it

Step: 1

blur-text-image

Get Instant Access to Expert-Tailored Solutions

See step-by-step solutions with expert insights and AI powered tools for academic success

Step: 2

blur-text-image_2

Step: 3

blur-text-image_3

Ace Your Homework with AI

Get the answers you need in no time with our AI-driven, step-by-step assistance

Get Started

Recommended Textbook for

Separation Process Principles With Applications Using Process Simulators

Authors: J. D. Seader

4th Edition

1119355230, 978-1119355236

More Books

Students also viewed these Chemistry questions

Question

Which state has the lowest sum of transaction amount?

Answered: 1 week ago