

Answered step by step
Verified Expert Solution
Question
1 Approved Answer
1. One-population hypothesis tests. A. Numeric data 1. Perform a T test to test the claim that the population mean is different from the
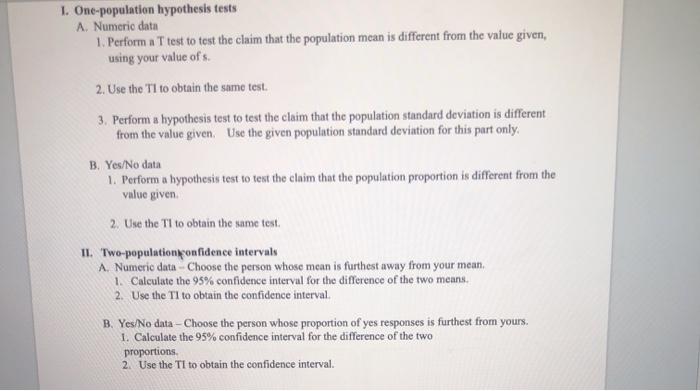

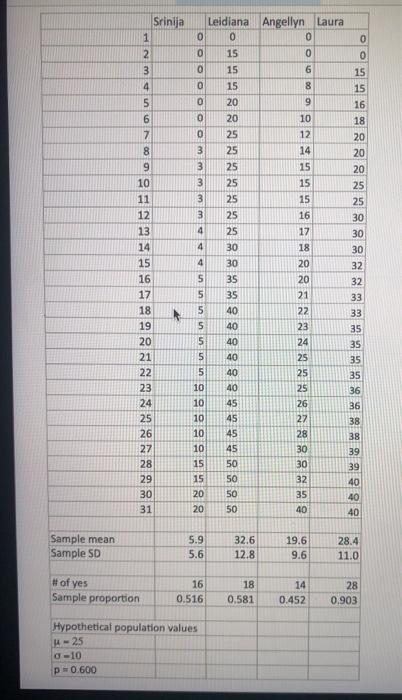
1. One-population hypothesis tests. A. Numeric data 1. Perform a T test to test the claim that the population mean is different from the value given, using your value of s. 2. Use the TI to obtain the same test. 3. Perform a hypothesis test to test the claim that the population standard deviation is different from the value given. Use the given population standard deviation for this part only. B. Yes/No data 1. Perform a hypothesis test to test the claim that the population proportion is different from the value given. 2. Use the TI to obtain the same test. II. Two-population confidence intervals A. Numeric data-Choose the person whose mean is furthest away from your mean. 1. Calculate the 95% confidence interval for the difference of the two means. 2. Use the TI to obtain the confidence interval. B. Yes/No data-Choose the person whose proportion of yes responses is furthest from yours. 1. Calculate the 95% confidence interval for the difference of the two proportions. 2. Use the TI to obtain the confidence interval. Note: For all hypothesis tests, use a = 0.05. Sample mean Sample SD 123&ST690 4 5 7 8 10 11 12 13 14 15 16 17 18 19 20 21 22 23 24 #of yes Sample proportion 25 26 27 28 29 30 31 Srinija Leidiana Angellyn Laura 72 0 0 0 3 4 4 4 5 0 15 0 0 0 3 3 3 3 5 5 5 555999994488 15 10 10 10 10 10 15 15 20 20 5.9 55 5.6 OSSER 84454554883599999944448888 15 Hypothetical population values 44-25 0-10 p= 0.600 15 20 20 25 25 25 25 25 25 25 30 30 40 40 40 40 40 40 50 50 50 50 32.6 12.8 16 18 0.516 0.581 88689 ON HS44SA98 10 12 14 15 15 15 16 17 18 20 20 21 22 23 24 25 25 25 26 27 28 30 30 32 35 40 19.6 9.6 14 0.452 0 0 15 15 6 28 20 20 20 25 25 30 30 30 2 32 33 33 35 35 35 35 36 35 8 8 9 0 0 0 16 18 32 36 38 38 39 39 40 40 40 28.4 11.0 28 0.903
Step by Step Solution
★★★★★
3.43 Rating (156 Votes )
There are 3 Steps involved in it
Step: 1
Certainly Lets go through each part step by step A Numeric Data 1 TTest Null hypothesis H0 0 population mean is equal to the given value Alternative hypothesis Ha 0 population mean is different from t...
Get Instant Access to Expert-Tailored Solutions
See step-by-step solutions with expert insights and AI powered tools for academic success
Step: 2

Step: 3
Ace Your Homework with AI
Get the answers you need in no time with our AI-driven, step-by-step assistance
Get Started
Understanding Basic Statistics
Authors: Charles Henry Brase, Corrinne Pellillo Brase
6th Edition
978-1133525097, 1133525091, 1111827028, 978-1133110316, 1133110312, 978-1111827021