

Question
1. Open the attached SPSS data file.This data set contains information about campaigns and election results for senatorial candidates in several states.A researcher is interested
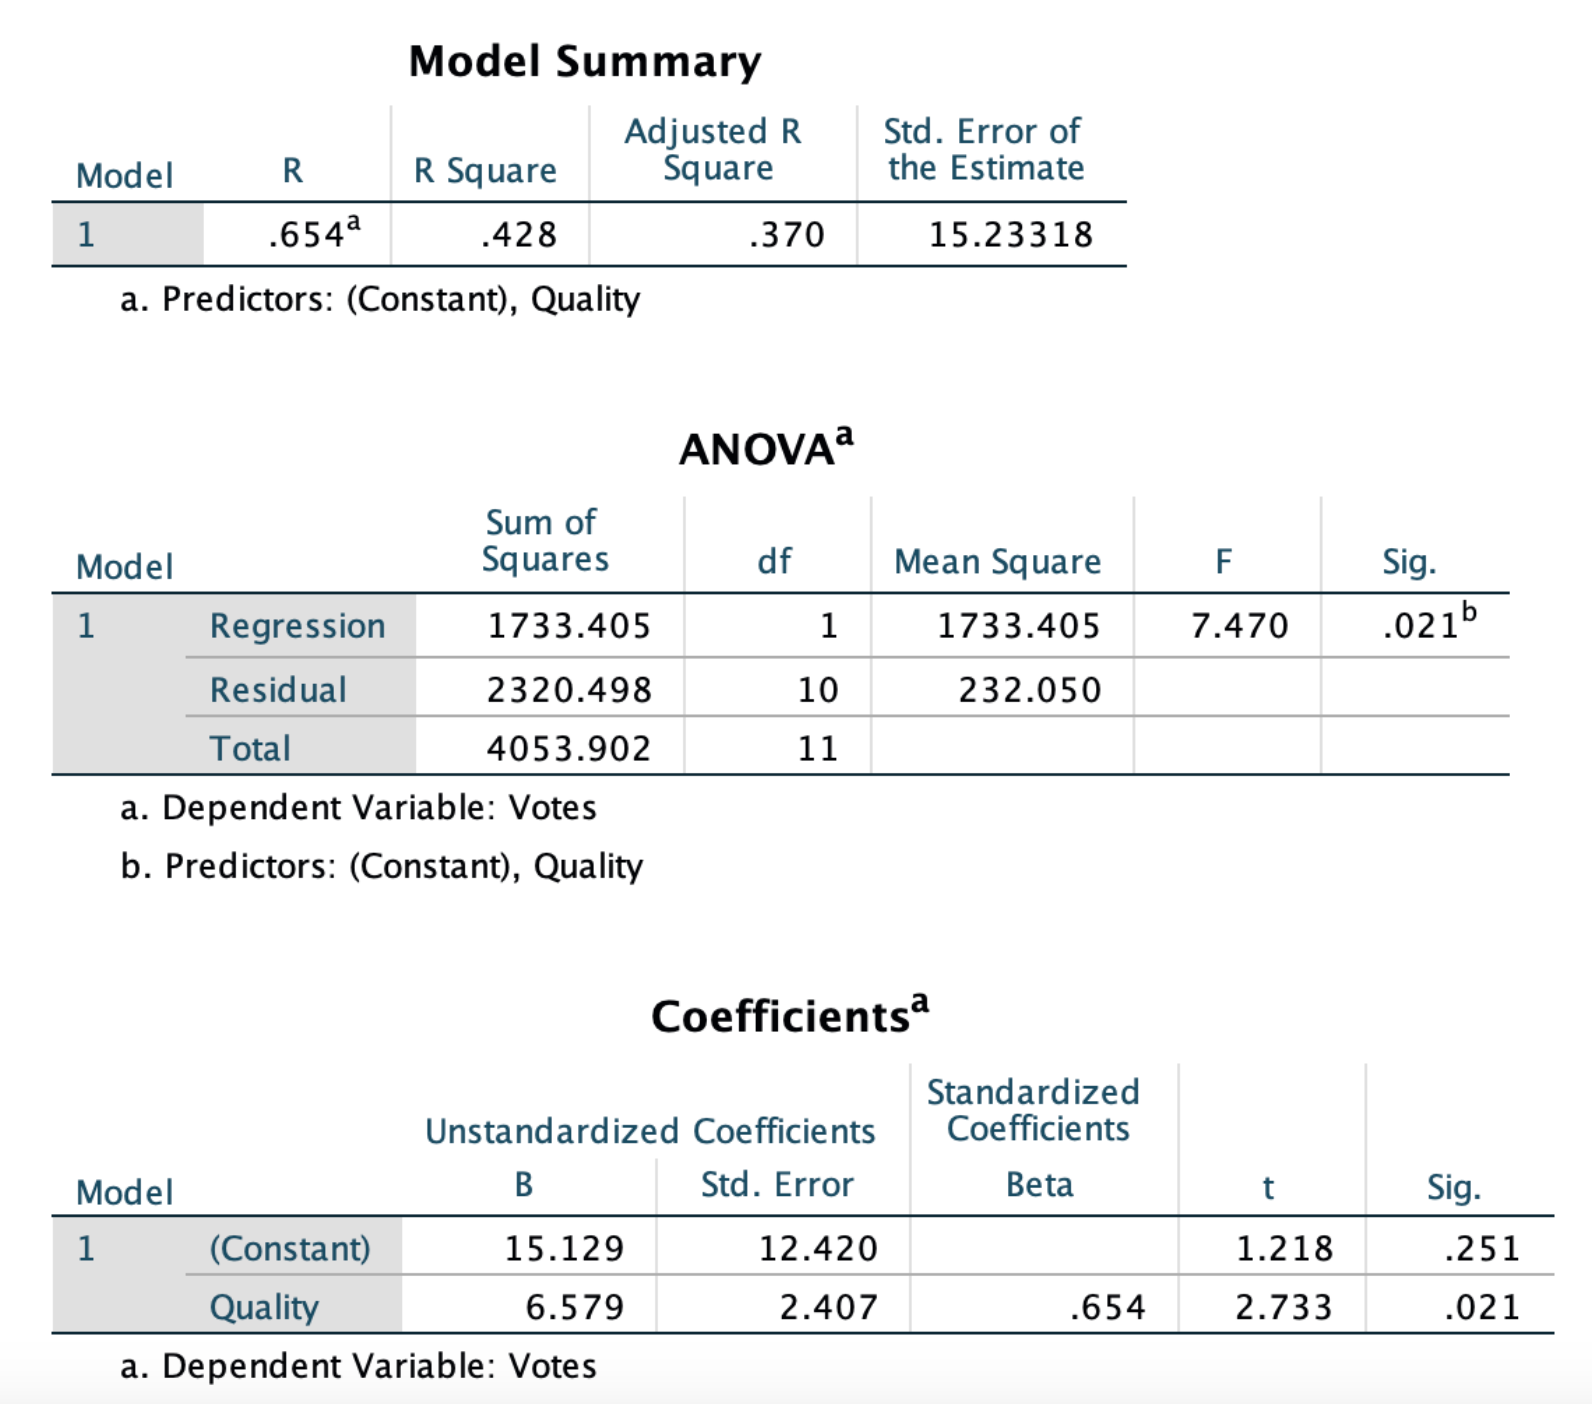
1.
Open the attached SPSS data file.This data set contains information about campaigns and election results for senatorial candidates in several states.A researcher is interested in whether the production quality of a candidate's campaign materials (i.e,. the quality of their website, television ads, and campaign videos) can be used to predict the percentage of votes that they will receive in an election.The "Quality" variable represents the production quality of campaign materials and the "Votes" variable represents the percentage of votes that the candidate received in their election.
Use the data to run a regression analysis in SPSS.
Based on the results of your analysis, the squared correlation between the observed and predicted scores of the "Votes" variable is equal to ______ .Enter your value with three decimal places.Do not include a zero to the left of the decimal point (i.e., .111, not 0.111, not .11, not .1).
2.
The ANOVA table included in your output tests the statistical significance of:
the correlation between "Votes" and "Quality".
the squared correlation between the observed and predicted scores on the "Votes" variable.
the squared correlation between the observed and predicted scores on the "Quality" variable.
the analysis of variance examining group differences in the dependent variable across the levels of the factor.
3.
From the results of your regression analysis, you can conclude that the R2value is statistically significant.You can draw this conclusion because the ________ used to test the R2have a p-value less than .05.
t-value
standardized coefficient
unstandardized coefficient
F-statistic
4
Based on the results of your analysis, the unstandardized slope of the regression equation is ________.Enter your answer with three decimal places (i.e., 10.111, not 10.01, not 10, not 10.1).
Step by Step Solution
There are 3 Steps involved in it
Step: 1

Get Instant Access to Expert-Tailored Solutions
See step-by-step solutions with expert insights and AI powered tools for academic success
Step: 2

Step: 3
Ace Your Homework with AI
Get the answers you need in no time with our AI-driven, step-by-step assistance
Get Started
Mathematical Applications For The Management, Life And Social Sciences
Authors: Ronald J. Harshbarger, James J. Reynolds
12th Edition
978-1337625340