Question
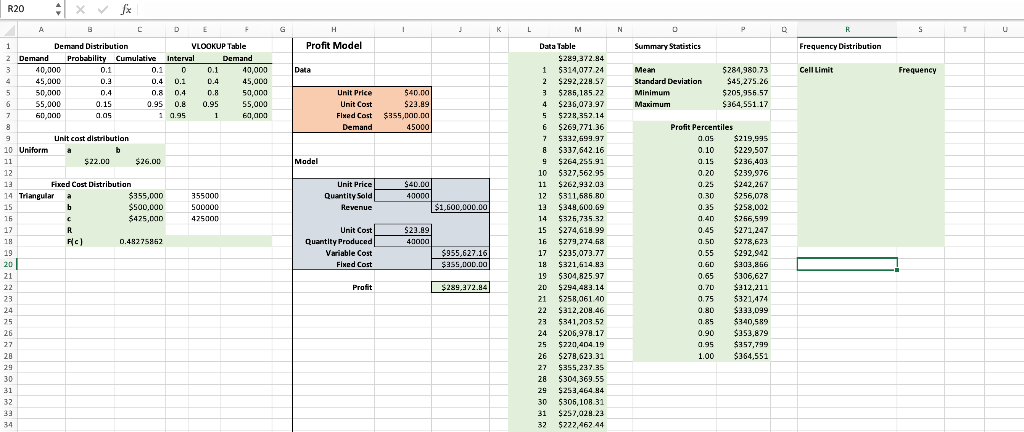
1. Percentiles also allow you to analyze risk. If the company needs to make a profit of at least $280,000, what is the probability of

1. Percentiles also allow you to analyze risk.
-
If the company needs to make a profit of at least $280,000, what is the probability of that happening?
The standard deviation of profit is quite large, and you can also see that the simulated values have a large range.
-
What does that mean for the predicted profit? Discuss in terms of variability.
-
Create a frequency distribution and histogram (using PowerBI) to provide a perspective of the variability. Insert your histogram in your write-up.
6. How do the results change if the quantity produced increases by $10,000? What if it decreases by 10,000?
a. Discuss the risk and monetary gain/loss in profit of producing more or less units.
Keep in mind that the number of units produced impacts unit price depending on demand. Discuss those implications (broadly)Reasonably estimate how many units produced maximizes profit for your firm. At what unit price? Do this by playing around with the Quantity Produced value, and watch themaximum value change.
R20 A Demand A 1 2 3 4 5 6 7 8 9 10 11 12 13 14 Triangular a 15 b 16 17 18 19 20 21 22 23 24 25 26 27 28 29 30 31 32 33 34 x fx B Demand Distribution C Probability Cumulative 0.1 0.3 0.4 0.15 0.05 Unit cost distribution b $22.00 Fixed Cost Distribution Uniform 40,000 45,000 50,000 55,000 60,000 C R F(c) D Interval 0.1 0 0.4 0.1 0.8 0.4 0.95 0.8 1 0.95 E F VLOOKUP Table 0.1 0.4 0.8 $26.00 $355,000 $500,000 $425,000 0.48275862 0.95 1 355000 500000 425000 Demand 40.000 45,000 50,000 55,000 60,000 G H Profit Model Data Unit Price Unit Cost Fixed Cost Demand Unit Price Quantity Sold Revenue Unit Cost Quantity Produced Variable Cost Fixed Cost Profit Model I $40.00 $23.89 $355,000.00 45000 $40.00 40000 $23.89 40000 J $1,600,000.00 $955,627.16 $355,000.00 $289,372.84 K L M Data Table $289,372.84 1 $314,077.24 2 $292,228.57 3 $285,185.22 4 $236,073.97 5 $228,352.14 6 $269,771.36 7 $332,699.97 8 $337,642.16 9 10 11 12 13 14 15 16 $264,255.91 $327,562.95 $262,932.03 $311.585.80 $349,600.69 $326.735.32 $274,618.99 $279,274.68 17 $235,073.77 18 $321,614.83 19 $304,825.97 20 $294,483.14 $312,208.46 21 $258,061.40 22 23 24 25 $341,203.52 $206,978.17 $220,404.19 26 $278,623.31 27 $355,237.35 28 $304,369.55 29 $253,464.84 30 $305,108.31 31 $257,029.23 32 $222,462.44 N D Summary Statistics Mean Standard Deviation Minimum Maximum P $284,980 73 $45,275.26 $205,956.57 $364,551.17 0.05 $219,995 $229,507 $236,403 $239,976 0.10 0.15 0.20 0.25 0.30 0.35 0.40 0.45 0.50 0.55 $292,942 0.60 $303,866 0.65 $306,627 $242,267 $256,078 $258,002 $256,599 $271,247 $278,623 0.70 $312,211 0.75 $321,474 0.80 $333,099 0.85 $340,589 0.90 $353,879 0.95 1.00 $357,799 $364,551 Profit Percentiles R Frequency Distribution Cell Limit S Frequency T U R20 A Demand A 1 2 3 4 5 6 7 8 9 10 11 12 13 14 Triangular a 15 b 16 17 18 19 20 21 22 23 24 25 26 27 28 29 30 31 32 33 34 x fx B Demand Distribution C Probability Cumulative 0.1 0.3 0.4 0.15 0.05 Unit cost distribution b $22.00 Fixed Cost Distribution Uniform 40,000 45,000 50,000 55,000 60,000 C R F(c) D Interval 0.1 0 0.4 0.1 0.8 0.4 0.95 0.8 1 0.95 E F VLOOKUP Table 0.1 0.4 0.8 $26.00 $355,000 $500,000 $425,000 0.48275862 0.95 1 355000 500000 425000 Demand 40.000 45,000 50,000 55,000 60,000 G H Profit Model Data Unit Price Unit Cost Fixed Cost Demand Unit Price Quantity Sold Revenue Unit Cost Quantity Produced Variable Cost Fixed Cost Profit Model I $40.00 $23.89 $355,000.00 45000 $40.00 40000 $23.89 40000 J $1,600,000.00 $955,627.16 $355,000.00 $289,372.84 K L M Data Table $289,372.84 1 $314,077.24 2 $292,228.57 3 $285,185.22 4 $236,073.97 5 $228,352.14 6 $269,771.36 7 $332,699.97 8 $337,642.16 9 10 11 12 13 14 15 16 $264,255.91 $327,562.95 $262,932.03 $311.585.80 $349,600.69 $326.735.32 $274,618.99 $279,274.68 17 $235,073.77 18 $321,614.83 19 $304,825.97 20 $294,483.14 $312,208.46 21 $258,061.40 22 23 24 25 $341,203.52 $206,978.17 $220,404.19 26 $278,623.31 27 $355,237.35 28 $304,369.55 29 $253,464.84 30 $305,108.31 31 $257,029.23 32 $222,462.44 N D Summary Statistics Mean Standard Deviation Minimum Maximum P $284,980 73 $45,275.26 $205,956.57 $364,551.17 0.05 $219,995 $229,507 $236,403 $239,976 0.10 0.15 0.20 0.25 0.30 0.35 0.40 0.45 0.50 0.55 $292,942 0.60 $303,866 0.65 $306,627 $242,267 $256,078 $258,002 $256,599 $271,247 $278,623 0.70 $312,211 0.75 $321,474 0.80 $333,099 0.85 $340,589 0.90 $353,879 0.95 1.00 $357,799 $364,551 Profit Percentiles R Frequency Distribution Cell Limit S Frequency T U
Step by Step Solution
There are 3 Steps involved in it
Step: 1

Get Instant Access to Expert-Tailored Solutions
See step-by-step solutions with expert insights and AI powered tools for academic success
Step: 2

Step: 3

Ace Your Homework with AI
Get the answers you need in no time with our AI-driven, step-by-step assistance
Get Started


