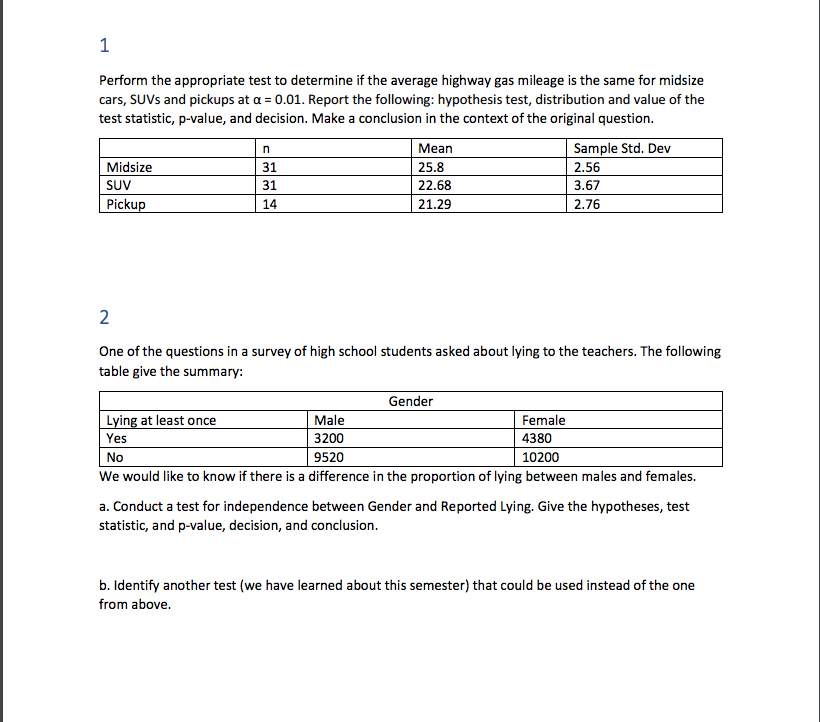
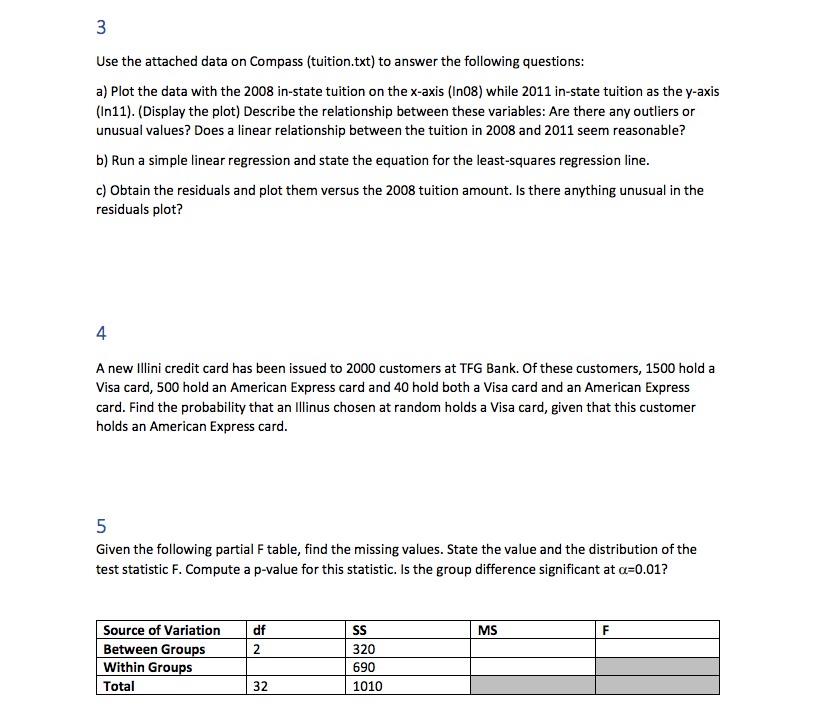
1 Perform the appropriate test to determine ifthe average highway gas mileage is the same for midsize cars, SU'v's and pickups at o = 0.01. Report the following: hypothesis test, distribution and value of the test statistic, p-value, and decision. Make a conclusion in the context of the original question. _m Sample-Std- Dev IIl___ 5W __ Pickup 14 21.29 2.36 2 One of the questions in a su rvev of high school students asked about lying to the teachers. The following table give the su mm arv: Gender L in at least once Male Female Yes 3209 433D No 9529 1DZDO We would like to know if the re is a difference in the proportion of lying between males and females. a. Conduct a test for independence between Gender and Reported Lv'ng. Give the hypotheses, test statistic, and p-value, decision, and conclusion. b. Identify another test {we have learned about this semeste r] that could be used instead of the one from above. 3 Use the attached data on Compass {tuitiontxt} to an swer the following questions: a} Flat the data with the 2003 in-state tuition an the x-axis {InD} while 2011 'In-state tu itiun as the v-axis [In11}. [Dis play the plot} Describe the relationship bemeen these variables: Are there any outliers or unusual values? Does a linear relationship between the tuition in 2008 and 2011 seem reasonable? b} Run a simple linear regression and state the equation for the least-sq uares regression line. cl Elbtain the residuals and plot them versus the 2008 tuition amount. Is there anvthing unusual in the residuals plot? 4 A new Illini credit card has been issued to 2000 customers at TFG Bank. or these customers, 1500 hold a Visa card, 500 hold an American Express card and 40 hold both a lllisa card and an American Express card. Find the pro babilitv that an Illinus chosen at random holds a Visa ca rd, given that this customer holds an American Express card. 5 Given the following partial F table, nd the missing values. State the value and the distribution of the ten statistic F. Compute a p-value for this statistic. Is the group difference signicant at 11:0.01? Source of Variation Between Groups F Within Grou s E_EEE_


