Question
1. Petro Chem is planning to buy a new refining plant in Canada. The plant is built with a total production capacity of 100 million
1. 
Petro Chem is planning to buy a new refining plant in Canada. The plant is built with a total production capacity of 100 million barrels of refined products. The variable cost of production per barrel is AED 50 of which fuel costs form 40%. The fixed cost to operate the plant per year is AED 8b.
a. What would be the selling price to achieve a break even assuming the plant is running at 95% utilisation?
b. Assume the product was sold at AED 150 per barrel. Due to a technical glitch in the plant, the utilisation dropped to 85% for a year. What would be the expected impact on the profit?
c. The oil price increased from AED 50 per barrel to AED 55 per barrel which would impact the production costs. What should be the new selling price to achieve a 10% profit margin at 95% utilisation?
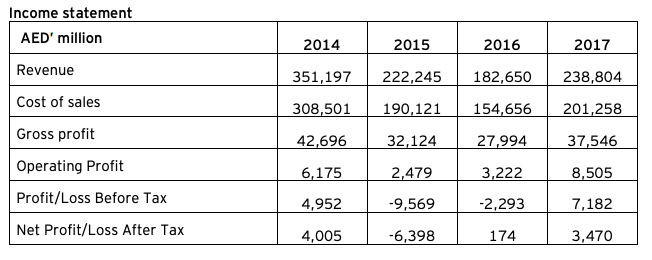
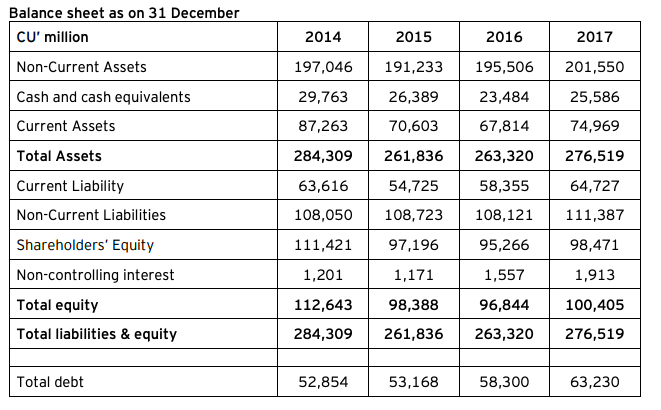
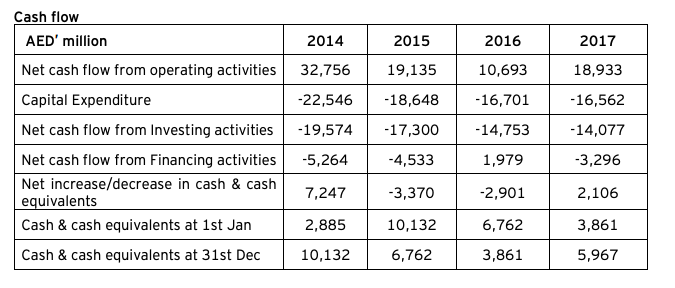
Income statement AED' million 2014 2015 2016 2017 Revenue 351,197 222,245 182,650 238,804 Cost of sales 308,501 190,121 154,656 201,258 Gross profit 42,696 32,124 27,994 37,546 Operating Profit 6,175 2,479 3,222 8,505 Profit/Loss Before Tax 4,952 -9,569 -2,293 7,182 Net Profit/Loss After Tax 4,005 -6,398 174 3,470 2014 2015 2016 2017 Balance sheet as on 31 December CU' million Non-Current Assets Cash and cash equivalents Current Assets 197,046 191,233 195,506 201,550 29,763 26,389 23,484 25,586 74,969 87,263 70,603 67,814 Total Assets 284,309 261,836 276,519 263,320 58,355 63,616 54,725 64,727 108,050 108,723 111,387 108,121 95,266 111,421 97,196 98,471 Current Liability Non-Current Liabilities Shareholders' Equity Non-controlling interest Total equity Total liabilities & equity 1,201 1,171 1,557 1,913 98,388 112,643 284,309 96,844 263,320 100,405 276,519 261,836 Total debt 52,854 53,168 58,300 63,230 Cash flow AED' million 2014 2015 2016 2017 19,135 10,693 18,933 -18,648 -16,701 -16,562 -17,300 -14,753 -14,077 Net cash flow from operating activities 32,756 Capital Expenditure -22,546 Net cash flow from Investing activities -19,574 Net cash flow from Financing activities -5,264 Net increase/decrease in cash & cash 7,247 equivalents Cash & cash equivalents at 1st Jan 2,885 Cash & cash equivalents at 31st Dec 10,132 -4,533 1,979 -3,296 -3,370 -2,901 2,106 10,132 6,762 3,861 6,762 3,861 5,967Step by Step Solution
There are 3 Steps involved in it
Step: 1

Get Instant Access to Expert-Tailored Solutions
See step-by-step solutions with expert insights and AI powered tools for academic success
Step: 2

Step: 3
Ace Your Homework with AI
Get the answers you need in no time with our AI-driven, step-by-step assistance
Get Started