

Answered step by step
Verified Expert Solution
Question
1 Approved Answer
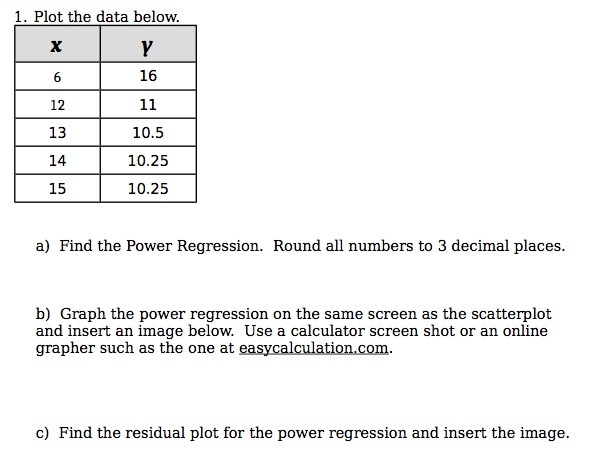
1. Plct the data helcw. a] Find the Pcwer Regression. Rcund all numbers tn 3 decimal places. 1}] Graph the newer regressicn en the same
Step by Step Solution
There are 3 Steps involved in it
Step: 1

Get Instant Access to Expert-Tailored Solutions
See step-by-step solutions with expert insights and AI powered tools for academic success
Step: 2

Step: 3
Ace Your Homework with AI
Get the answers you need in no time with our AI-driven, step-by-step assistance
Get Started
Transportation A Global Supply Chain Perspective
Authors: John J. Coyle, Robert A. Novak, Brian Gibson, Edward J. Bard
8th edition
9781305445352, 1133592961, 130544535X, 978-1133592969