Answered step by step
Verified Expert Solution
Question
1 Approved Answer
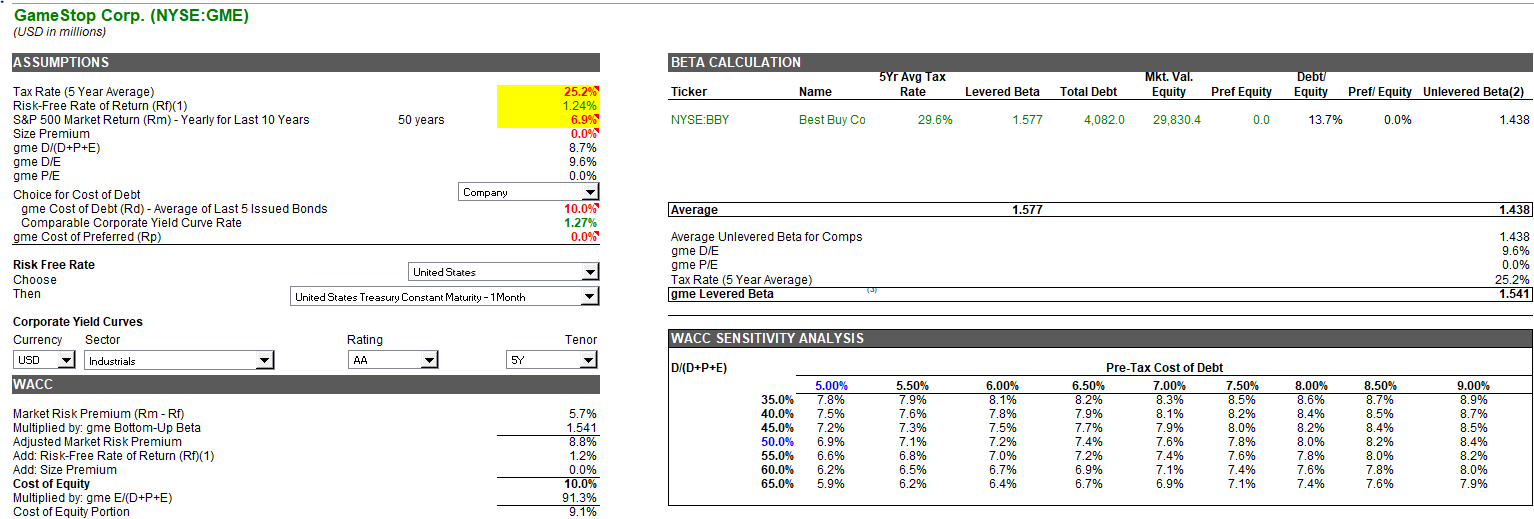
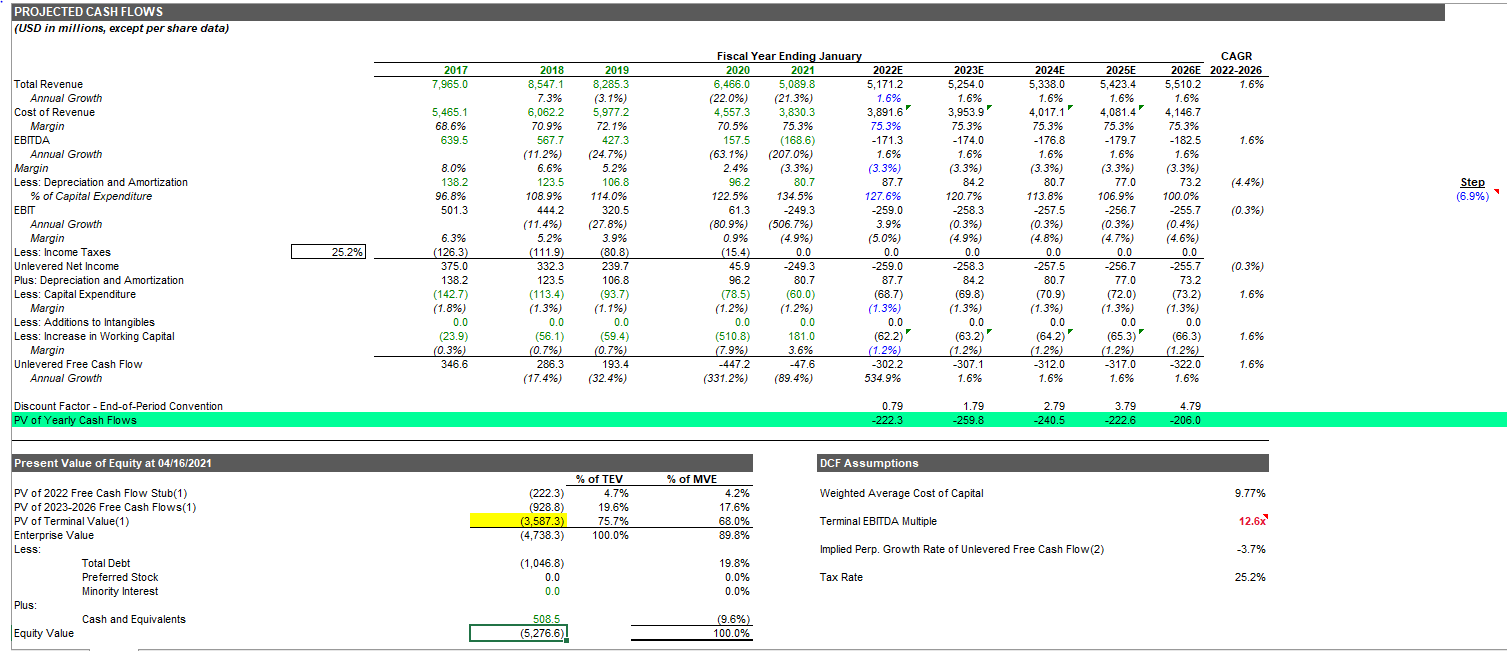
1. please analyze why the implied per share is negative on the DCF analysis. 2. attempted to find the implied per share value on the
1. please analyze why the implied per share is negative on the DCF analysis.


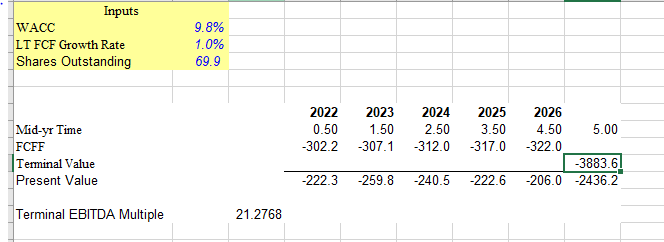
2. attempted to find the implied per share value on the second slide. please compare the difference.

3. in a few sentences, please compare the difference of calculating pv of terminal value through time value of money vs terminal EBITDA multiple
Game Stop Corp. (NYSE:GME) (USD in millions) ASSUMPTIONS BETA CALCULATION 5Yr Avg Tax Rate Debt Equity Name Levered Beta Mkt. Val. Equity Total Debt Pref Equity Prefi Equity Unlevered Beta(2) Ticker NYSE:BBY : 50 years Best Buy Co 29.6% 1.577 Tax Rate (5 Year Average) Risk-Free Rate of Return (Rp) (1) S&P 500 Market Return (Rm) - Yearly for Last 10 Years Size Premium gme D/CD+P+E) gme D/E 4,082.0 29,830.4 0.0 13.7% 0.0% 1.438 25.2% 1.24% 6.9% 0.0% 8.7% 9.6% 0.0% gme P/E Company Average 1.577 Choice for Cost of Debt gme Cost of Debt (Rd) - Average of Last 5 Issued Bonds Comparable Corporate Yield Curve Rate gme Cost of Preferred (Rp) 1.438 10.0% 1.27% 0.0% Risk Free Rate Choose Then Average Unlevered Beta for Comps gme D/E gme P/E Tax Rate (5 Year Average) gme Levered Beta 1.438 9.6% 0.0% 25.2% 1.541 United States United States Treasury Constant Maturity - 1 Month Corporate Yield Curves Currency Sector USD Industrials Rating Tenor WACC SENSITIVITY ANALYSIS AA 5Y D/CD+P+E) WACC Market Risk Premium (Rm - Rf) Multiplied by: gme Bottom-Up Beta Adjusted Market Risk Premium Add: Risk-Free Rate of Return (Rf)(1) Add: Size Premium Cost of Equity Multiplied by: gme E/(D+P+E) Cost of Equity Portion TII 5.7% 1.541 8.8% 1.2% 0.0% 10.0% 91.3% 9.1% 35.0% 40.0% 45.0% 50.0% 55.0% 60.0% 65.0% 5.00% % 7.8% 7.5% 7.2% 6.9% 6.6% 6.2% 5.9% 5.50% 7.9% 7.6% 7.3% 7.1% 6.8% 6.5% 6.2% 6.00% 8.1% 7.8% 7.5% 7.2% % 7.0% 6.7% 6.4% Pre-Tax Cost of Debt 6.50% 7.00% 7.50% 8.2% 8.3% 8.5% 7.9% 8.1% 8.2% 7.7% 7.9% 8.0% 7.4% 7.6% 7.8% % 7.2% 7.4% 7.6% 6.9% 7.1% 7.4% 6.7% 6.9% 7.1% 8.00% 8.6% 8.4% 8.2% 8.0% 7.8% 7.6% 7.4% 8.50% 8.7% 8.5% 8.4% 8.2% 8.0% 7.8% 7.6% % 9.00% 8.9% 8.7% 8.5% 8.4% 8.2% 8.0% 7.9% WACC SENSITIVITY ANALYSIS E/(D+P+E) gme Cost of Debt (Rd) - Average of Last 5 Issued Bonds Tax Rate (5 Year Average) After-Tax Cost of Debt Multiplied by: gme D/(D+P+E) Cost of Debt Portion 10.0% 25.2% 7.5% 8.7% 0.7% 2.00% 1.4% 1.5% 1.6% 1.7% 1.8% 1.9% 2.0% 35.0% 40.0% 45.0% 50.0% 55.0% 60.0% 65.0% 2.75% 1.6% 1.8% 1.9% 2.0% 2.2% 2.3% 2.4% gme Cost of Preferred (Rp) Multiplied by: gme P/(D+P+E) Cost of Preferred Portion 3.50% 1.9% 2.1% 2.2% 2.4% 2.6% 2.8% 2.9% 4.25% 2.1% 2.4% 2.6% 2.8% 3.0% 3.2% 3.4% Cost of Equity 5.00% 2.4% 2.7% 2.9% 3.2% 3.4% 3.7% 3.9% 5.75% 2.7% 3.0% 3.2% 3.5% 3.8% 4.1% 4.4% 6.50% 2.9% 3.3% 3.6% 3.9% 4.2% 4.6% 4.9% 7.25% 3.2% 3.6% 3.9% 4.3% 4.6% 5.0% 5.4% 8.00% 3.5% 3.9% 4.3% 4.7% 5.1% 5.5% 5.9% 0.0% 0.0% 0.0% WACC 9.8% (1) Interest on United States Treasury Constant Maturity - 1 Month (2) Unlevered Beta = Levered Beta /(1 + ((D/E)*(1-1)) + P/E) (3) Levered Beta = Unlevered Beta *(1 + ((D/E) * (1 - T)) + P/E) Source: S&P Capital IQ Copyright 2019 S&P Global Market Intelligence LLC (and its affiliates as applicable) All rights reserved. This model and/or any data in it are provided subject to the written agreement of S&P Global Market Intelligence LLC governing the subscription service to which this model is applied. PROJECTED CASH FLOWS (USD in millions, except per share data) 2017 7,965.0 2019 8,285.3 (3.1%) 2024E 5,338,0 1.6% 2025E 5,423.4 1.6% CAGR 2026E 2022-2026 5,510.2 1.6% 1.6% 5,977.2 3,830.3 2023E 5,254.0 1.6% 3,953.97 75.3% -174.0 1.6% 4,017.1" 4,081.4) 5,465.1 68.6% 639.5 4,146.7 75.3% -176.8 1.6% 75.3% -179.7 1.6% 1.6% (3.3%) (3.3%) (3.3%) 8.0% 138.2 96.8% 501.3 Step (6.9%) (0.3%) Total Revenue Annual Growth Cost of Revenue Margin EBITDA Annual Growth Margin Less: Depreciation and Amortization % of Capital Expenditure EBIT Annual Growth Margin Less: Income Taxes Unlevered Net Income Plus: Depreciation and Amortization Less: Capital Expenditure Margin Less: Additions to Intangibles Less: Increase in Working Capital Margin Unlevered Free Cash Flow Annual Growth 2018 8,547.1 7.3% 6,062.2 70.9% 567.7 (11.2%) 6.6% 123.5 108.9% 444.2 (11.4%) 5.2% (111.9) 332.3 123.5 (113.4) (1.3%) 0.0 (56.1) (0.7%) 286.3 (17.4%) 72.1% 427.3 (24.7%) 5.2% 106.8 114.0% 320.5 (27.8%) 3.9% (80.8) 239.7 106.8 (93.7) (1.1%) 0.0 Fiscal Year Ending January 2020 2021 2022E 6,466.0 5,089.8 5,171.2 (22.0%) (21.3%) 1.6% % 4,5573 3,891.6' 70.5% 75.3% 75.3% 157.5 (168.6) -171.3 (63.1%) (207.0%) 1.6% % 2.4% (3.3%) (3.3%) 96.2 80.7 87.7 122.5% 134.5% 127.6% 61.3 -249.3 -259.0 (80.9%) (506.7%) 3.9% 0.9% (4.9%) (5.0%) (15.4) 0.0 0.0 45.9 -249.3 -259.0 96.2 80.7 87.7 (78.5) (60.0) (68.7) (1.2%) (1.2%) (1.3%) 0.0 0.0 0.0 (510.8) 181.0 (62.2) (7.9%) 3.6% (1.2%) -447.2 -47.6 302.2 (331.2%) (89.4%) 534.9% - 25.2% 25.2% (0.3%) 84.2 120.7% -258.3 (0.3%) (4.9%) 0.0 -258.3 84.2 (69.8) (1.3%) 0.0 (63.2) (1.2%) -307.1 1.6% 6.3% (126.3) 375.0 138.2 (142.7) (1.8%) 0.0 (23.9) (0.3%) 346.6 80.7 113.8% -257.5 (0.3%) (4.8%) 0.0 -257.5 80.7 (70.9) (1.3%) 0.0 (64.2) (1.2%) -312.0 1.6% 75.3% -182.5 1.6% (3.3%) 73.2 100.0% -255.7 (0.4%) (4.6%) 0.0 -255.7 73.2 (73.2) (1.3%) 0.0 (66.3) (1.2%) -322.0 1.6% 77.0 106.9% -256.7 (0.3%) (4.7%) 0.0 -256.7 77.0 (72.0) (1.3%) 0.0 (65.3) (1.2%) 317.0 1.6% 1.6% (59.4) 1.6% (0.7%) 193.4 (32.4% 1.6% Discount Factor-End-of-Period Convention PV of Yearly Cash Flows 0.79 -222.3 1.79 -259,8 2.79 -240.5 3.79 -222.6 4.79 -206.0 Present Value of Equity at 04/16/20 DCF Assumptions Weighted Average Cost of Capital 9.77% PV of 2022 Free Cash Flow Stub(1) PV of 2023-2026 Free Cash Flows(1) PV of Terminal Value(1) Enterprise Value (222.3) (928.8) (3.587.3) (4,738.3) % of TEV 4.7% 19.6% 75.7% 100.0% % of MVE 4.2% 17.6% 68.0% 89.8% Terminal EBITDA Multiple 12.6x Less Implied Perp. Growth Rate of Unlevered Free Cash Flow (2) -3.7% Total Debt Preferred Stock Minority Interest (1,046.8) 0.0 0.0 19.8% 0.0% 0.0% Tax Rate 25.2% Plus: Cash and Equivalents 508.5 (5,276.6) (9.6%) 100.0% Equity Value Inputs WACC LT FCF Growth Rate Shares Outstanding 9.8% 1.0% 69.9 2024 2022 0.50 -302.2 2023 1.50 -307.1 2.50 -312.0 2025 3.50 -317.0 Mid-yr Time FCFF Terminal Value Present Value 2026 4.50 5.00 -322.0 -3883.6 -206.0 -2436.2 -222.3 -259.8 -240.5 -222.6 Terminal EBITDA Multiple 21.2768 Game Stop Corp. (NYSE:GME) (USD in millions) ASSUMPTIONS BETA CALCULATION 5Yr Avg Tax Rate Debt Equity Name Levered Beta Mkt. Val. Equity Total Debt Pref Equity Prefi Equity Unlevered Beta(2) Ticker NYSE:BBY : 50 years Best Buy Co 29.6% 1.577 Tax Rate (5 Year Average) Risk-Free Rate of Return (Rp) (1) S&P 500 Market Return (Rm) - Yearly for Last 10 Years Size Premium gme D/CD+P+E) gme D/E 4,082.0 29,830.4 0.0 13.7% 0.0% 1.438 25.2% 1.24% 6.9% 0.0% 8.7% 9.6% 0.0% gme P/E Company Average 1.577 Choice for Cost of Debt gme Cost of Debt (Rd) - Average of Last 5 Issued Bonds Comparable Corporate Yield Curve Rate gme Cost of Preferred (Rp) 1.438 10.0% 1.27% 0.0% Risk Free Rate Choose Then Average Unlevered Beta for Comps gme D/E gme P/E Tax Rate (5 Year Average) gme Levered Beta 1.438 9.6% 0.0% 25.2% 1.541 United States United States Treasury Constant Maturity - 1 Month Corporate Yield Curves Currency Sector USD Industrials Rating Tenor WACC SENSITIVITY ANALYSIS AA 5Y D/CD+P+E) WACC Market Risk Premium (Rm - Rf) Multiplied by: gme Bottom-Up Beta Adjusted Market Risk Premium Add: Risk-Free Rate of Return (Rf)(1) Add: Size Premium Cost of Equity Multiplied by: gme E/(D+P+E) Cost of Equity Portion TII 5.7% 1.541 8.8% 1.2% 0.0% 10.0% 91.3% 9.1% 35.0% 40.0% 45.0% 50.0% 55.0% 60.0% 65.0% 5.00% % 7.8% 7.5% 7.2% 6.9% 6.6% 6.2% 5.9% 5.50% 7.9% 7.6% 7.3% 7.1% 6.8% 6.5% 6.2% 6.00% 8.1% 7.8% 7.5% 7.2% % 7.0% 6.7% 6.4% Pre-Tax Cost of Debt 6.50% 7.00% 7.50% 8.2% 8.3% 8.5% 7.9% 8.1% 8.2% 7.7% 7.9% 8.0% 7.4% 7.6% 7.8% % 7.2% 7.4% 7.6% 6.9% 7.1% 7.4% 6.7% 6.9% 7.1% 8.00% 8.6% 8.4% 8.2% 8.0% 7.8% 7.6% 7.4% 8.50% 8.7% 8.5% 8.4% 8.2% 8.0% 7.8% 7.6% % 9.00% 8.9% 8.7% 8.5% 8.4% 8.2% 8.0% 7.9% WACC SENSITIVITY ANALYSIS E/(D+P+E) gme Cost of Debt (Rd) - Average of Last 5 Issued Bonds Tax Rate (5 Year Average) After-Tax Cost of Debt Multiplied by: gme D/(D+P+E) Cost of Debt Portion 10.0% 25.2% 7.5% 8.7% 0.7% 2.00% 1.4% 1.5% 1.6% 1.7% 1.8% 1.9% 2.0% 35.0% 40.0% 45.0% 50.0% 55.0% 60.0% 65.0% 2.75% 1.6% 1.8% 1.9% 2.0% 2.2% 2.3% 2.4% gme Cost of Preferred (Rp) Multiplied by: gme P/(D+P+E) Cost of Preferred Portion 3.50% 1.9% 2.1% 2.2% 2.4% 2.6% 2.8% 2.9% 4.25% 2.1% 2.4% 2.6% 2.8% 3.0% 3.2% 3.4% Cost of Equity 5.00% 2.4% 2.7% 2.9% 3.2% 3.4% 3.7% 3.9% 5.75% 2.7% 3.0% 3.2% 3.5% 3.8% 4.1% 4.4% 6.50% 2.9% 3.3% 3.6% 3.9% 4.2% 4.6% 4.9% 7.25% 3.2% 3.6% 3.9% 4.3% 4.6% 5.0% 5.4% 8.00% 3.5% 3.9% 4.3% 4.7% 5.1% 5.5% 5.9% 0.0% 0.0% 0.0% WACC 9.8% (1) Interest on United States Treasury Constant Maturity - 1 Month (2) Unlevered Beta = Levered Beta /(1 + ((D/E)*(1-1)) + P/E) (3) Levered Beta = Unlevered Beta *(1 + ((D/E) * (1 - T)) + P/E) Source: S&P Capital IQ Copyright 2019 S&P Global Market Intelligence LLC (and its affiliates as applicable) All rights reserved. This model and/or any data in it are provided subject to the written agreement of S&P Global Market Intelligence LLC governing the subscription service to which this model is applied. PROJECTED CASH FLOWS (USD in millions, except per share data) 2017 7,965.0 2019 8,285.3 (3.1%) 2024E 5,338,0 1.6% 2025E 5,423.4 1.6% CAGR 2026E 2022-2026 5,510.2 1.6% 1.6% 5,977.2 3,830.3 2023E 5,254.0 1.6% 3,953.97 75.3% -174.0 1.6% 4,017.1" 4,081.4) 5,465.1 68.6% 639.5 4,146.7 75.3% -176.8 1.6% 75.3% -179.7 1.6% 1.6% (3.3%) (3.3%) (3.3%) 8.0% 138.2 96.8% 501.3 Step (6.9%) (0.3%) Total Revenue Annual Growth Cost of Revenue Margin EBITDA Annual Growth Margin Less: Depreciation and Amortization % of Capital Expenditure EBIT Annual Growth Margin Less: Income Taxes Unlevered Net Income Plus: Depreciation and Amortization Less: Capital Expenditure Margin Less: Additions to Intangibles Less: Increase in Working Capital Margin Unlevered Free Cash Flow Annual Growth 2018 8,547.1 7.3% 6,062.2 70.9% 567.7 (11.2%) 6.6% 123.5 108.9% 444.2 (11.4%) 5.2% (111.9) 332.3 123.5 (113.4) (1.3%) 0.0 (56.1) (0.7%) 286.3 (17.4%) 72.1% 427.3 (24.7%) 5.2% 106.8 114.0% 320.5 (27.8%) 3.9% (80.8) 239.7 106.8 (93.7) (1.1%) 0.0 Fiscal Year Ending January 2020 2021 2022E 6,466.0 5,089.8 5,171.2 (22.0%) (21.3%) 1.6% % 4,5573 3,891.6' 70.5% 75.3% 75.3% 157.5 (168.6) -171.3 (63.1%) (207.0%) 1.6% % 2.4% (3.3%) (3.3%) 96.2 80.7 87.7 122.5% 134.5% 127.6% 61.3 -249.3 -259.0 (80.9%) (506.7%) 3.9% 0.9% (4.9%) (5.0%) (15.4) 0.0 0.0 45.9 -249.3 -259.0 96.2 80.7 87.7 (78.5) (60.0) (68.7) (1.2%) (1.2%) (1.3%) 0.0 0.0 0.0 (510.8) 181.0 (62.2) (7.9%) 3.6% (1.2%) -447.2 -47.6 302.2 (331.2%) (89.4%) 534.9% - 25.2% 25.2% (0.3%) 84.2 120.7% -258.3 (0.3%) (4.9%) 0.0 -258.3 84.2 (69.8) (1.3%) 0.0 (63.2) (1.2%) -307.1 1.6% 6.3% (126.3) 375.0 138.2 (142.7) (1.8%) 0.0 (23.9) (0.3%) 346.6 80.7 113.8% -257.5 (0.3%) (4.8%) 0.0 -257.5 80.7 (70.9) (1.3%) 0.0 (64.2) (1.2%) -312.0 1.6% 75.3% -182.5 1.6% (3.3%) 73.2 100.0% -255.7 (0.4%) (4.6%) 0.0 -255.7 73.2 (73.2) (1.3%) 0.0 (66.3) (1.2%) -322.0 1.6% 77.0 106.9% -256.7 (0.3%) (4.7%) 0.0 -256.7 77.0 (72.0) (1.3%) 0.0 (65.3) (1.2%) 317.0 1.6% 1.6% (59.4) 1.6% (0.7%) 193.4 (32.4% 1.6% Discount Factor-End-of-Period Convention PV of Yearly Cash Flows 0.79 -222.3 1.79 -259,8 2.79 -240.5 3.79 -222.6 4.79 -206.0 Present Value of Equity at 04/16/20 DCF Assumptions Weighted Average Cost of Capital 9.77% PV of 2022 Free Cash Flow Stub(1) PV of 2023-2026 Free Cash Flows(1) PV of Terminal Value(1) Enterprise Value (222.3) (928.8) (3.587.3) (4,738.3) % of TEV 4.7% 19.6% 75.7% 100.0% % of MVE 4.2% 17.6% 68.0% 89.8% Terminal EBITDA Multiple 12.6x Less Implied Perp. Growth Rate of Unlevered Free Cash Flow (2) -3.7% Total Debt Preferred Stock Minority Interest (1,046.8) 0.0 0.0 19.8% 0.0% 0.0% Tax Rate 25.2% Plus: Cash and Equivalents 508.5 (5,276.6) (9.6%) 100.0% Equity Value Inputs WACC LT FCF Growth Rate Shares Outstanding 9.8% 1.0% 69.9 2024 2022 0.50 -302.2 2023 1.50 -307.1 2.50 -312.0 2025 3.50 -317.0 Mid-yr Time FCFF Terminal Value Present Value 2026 4.50 5.00 -322.0 -3883.6 -206.0 -2436.2 -222.3 -259.8 -240.5 -222.6 Terminal EBITDA Multiple 21.2768Step by Step Solution
There are 3 Steps involved in it
Step: 1

Get Instant Access to Expert-Tailored Solutions
See step-by-step solutions with expert insights and AI powered tools for academic success
Step: 2

Step: 3

Ace Your Homework with AI
Get the answers you need in no time with our AI-driven, step-by-step assistance
Get Started


